


- >
- Building Typology>
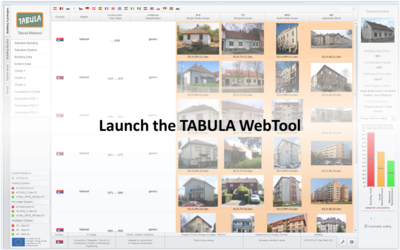
- TABULA WebTool
TABULA WebTool & FAQ
2017-07-21 15:30 +++ Error caused by power outage has been fixed.
2017-07-20 15:00 +++ NOTIFICATION +++
Disturbance of the webtool database. The error will soon be fixed ...
webtool.building-typology.eu
Background
Objectives
The TABULA WebTool has been developed within the framework of the Intelligent Energy Europe projects TABULA and EPISCOPE.
The objective is to disseminate the general idea of national residential building typologies to building experts from European countries and to give them an understanding of the concrete implementation according to the TABULA concept www.episcope.eu/building-typology:
- The division of residential building stocks in size and age classes;
- Data of exemplary buildings: visual appearance, commonly found construction elements and corresponding U-values;
- Data of exemplary heat supply systems: commonly found system types and their energy performance indicators;
- Typical values for the energy consumption by energy carriers;
- For old buildings: energy saving measures on two quality levels and their impact on the energy consumption;
- For new buildings: examples for realisation on three energy performance levels: minimum requirements, improved and ambitious or NZEB standard (assumed or announced level of Nearly Zero-Energy Buildings).
- Standard reference calculation procedure based on an agreed data format, user conditions and national climatic data;
- Calibration of the standard calculation procedure to the typical level of measured consumption.
Section "Building Typologies" – Principles and Functions in a Nutshell
- According to the TABULA concept a national residential building stock is divided in size and age classes. The resulting grid is called "building type matrix". Each element of this main matrix is a "generic building type" (indicated by the building type code suffix "Gen"). In principle, each residential building of a national stock can be assigned to one generic building type of the national building type matrix. Information about frequencies of buildings per building type can be found at the "Country Pages" of the EPISCOPE website.
- Further divisions in sub-types have been created in some countries to consider special building appearances or construction principles (indicated by the code suffix being different from "Gen").
- The TABULA WebTool assigns to each of the building types one exemplary building. Similar buildings (with regard to appearance and structure) can commonly be found in the countries. The exemplary building represents one possible occurrence within a wide range of each property and cannot be seen as representative in a statistical sense.
- In some cases datasets of exemplary building have not yet been assigned to building types (even though pictures are already existing). The building pictures are displayed only in a wash-out manner and there is no energy performance calculation.
- The energy performance is calculated by use of the TABULA reference calculation procedure (www.episcope.eu/fileadmin/tabula/public/docs/report/TABULA_CommonCalculationMethod.pdf). In the standard mode the charts of the webtool are displaying the calculation results calibrated to the typical level of measured consumption. By changing the settings of the tool it is possible to switch to the standard calculation (not adapted). If for a country calibration factors are not available (even not on an expert estimation basis) adaptation factors averaged for the other countries are used.
- In the programme settings also the energy carrier assessment (non-renewable and total primary energy factors, carbon dioxide emission factors, energy prices) can be switched from European standard values to national values. The national values have been provided by the responsible partners. The European primary energy factors are based on prEN 15603:2013, Table A.8; the CO2 emission factors have been derived from EN 15603:2006, Annex E."
Section "Building Stocks"
Explanations see: episcope.eu/monitoring/average-buildings/
Explanations
TABULA Reference Floor Area
The TABULA reference floor area is the conditioned floor area based on internal dimensions (measured from edges at the inside surface of external walls). In principle it is defined as the net internal area (= total building area measured inside external and internal walls). If the gross internal area (= total building area measured inside external walls) is available it can also directly used as TABULA reference area, since the difference is small.
If this area is available for buildings of a country the TABULA reference area will be derived directly from it. If it is not available, the TABULA reference area is estimated by use of the available reference quantities using specific conversion factors. More information can be found in the documentation of the TABULA calculation procedure:
episcope.eu/fileadmin/tabula/public/docs/report/TABULA_CommonCalculationMethod.pdf
Energy balance diagrams
Energy need for heating (net/gross): In the TABULA WebTool charts, a distinction is made between "net" and "gross" only if a ventilation system with heat recovery is available. The gross heat need is the amount of heat that the heating system and heat recovery provide - this is the entire column in the diagram. The lower part of the column (with light color values) shows the net neat need, the amount of heat that the heating system alone has to provide.
If the graphic's dropdown menu is set to "Energy need for heating", the columns only refer to heating - in the other cases always to heating and hot water.
FAQ - Frequently Asked Questions
Dataset identification - codes
Q: Why do I have for the same kind of building three different acronyms with different value especially for the U-value? For example: AT.N.AB.01.Gen.ReEx.001.001- AT.N.AB.01.Gen.ReEx.001.002- AT.N.AB.01.Gen.ReEx.001.003 (Only the last number change)
A: The last number is the variant number of the building. In the common typology concept this is representing the energy performance level 1, 2 and 3, see interpretation for the different countries at the “about page” of the WebTool.
Q: What is the meaning of "ReEx" and "SyAv" on the acronyms? For example "DK.N.AB.01.Gen.ReEx.001.001" and "DK.N.AB.01.Gen.SyAv.001.001"
Internal heat capacity used for calculating the energy demand for heating
Q: The internal heat capacity is for every building variant 45 Wh/(m2K). I am wondering what the internal heat capacity means. It is quite low for a whole building, is it just the furniture? And is there a way to calculate the (effective) capacity for the whole building variant?
A: You are absolutely right, the internal heat capacity used to calculate the time constant and the gain utilisation factor (see: episcope.eu/fileadmin/tabula/public/docs/report/TABULA_CommonCalculationMethod.pdf) are unrealistic low in the TABULA procedure. The reason is that – at the time of the development of the method – we wanted to correct a systematic deviation between the seasonal method and the monthly method (only a small one: 1 to 2 %!) found in a parameter study by setting the internal heat capacity to half of the typical standard value (unfortunately, only in German language: chapter 3.4 in www.iwu.de/fileadmin/publikationen/energie/werkzeuge/2004_IWU_Loga_Die-Heizperiodenbilanz-im-Vergleich-zum-Monatsbilanzverfahren.pdf + dx.doi.org/10.1002/bapi.200300020)
So, this quantity is more an adapted parameter of the calculation procedure and does not reflect the real internal heat capacity of a building.
However, in the meantime, the reason for the systematic deviation became clearer: The systematic deviation seems to be caused by the simplified method to derive the solar radiation at heating days from monthly solar data, which was used in the study mentioned above. We now found out that we overestimated the radiation when we derived this value by dividing the number of heating days by the number of days of the respective month and multiplying it with the solar radiation of the month. In a parameter study we derived a correction factor for the solar radiation at heating days (chapter 2.4 in www.iwu.de/fileadmin/publikationen/energie/mobasy/2020_IWU_LogaGrossklosLandgraf_MOBASYTeilberichtKlimadatenRealbilanzierung.pdf, also only in German) which we can now use in combination with a realistic internal heat capacity (which would assume about twice the current value). However, we have not yet documented this change in a publication related to the TABULA method (due to lack of time).
So, in summary the standard value applied by the method is not usable for research questions. Also, the real heat capacity of the example buildings displayed at the TABULA WebTool has not been determined, since the influence on the energy demand for heating is very low (see: passipedia.org/basics/internal_heat_capacity).