


- >
- Building Typology>
- COUNTRY PAGES>
- PL Poland
PL Poland - Country Page
National Contact Point
Information in Polish language: National Contact Point Poland
Residential Building Typology
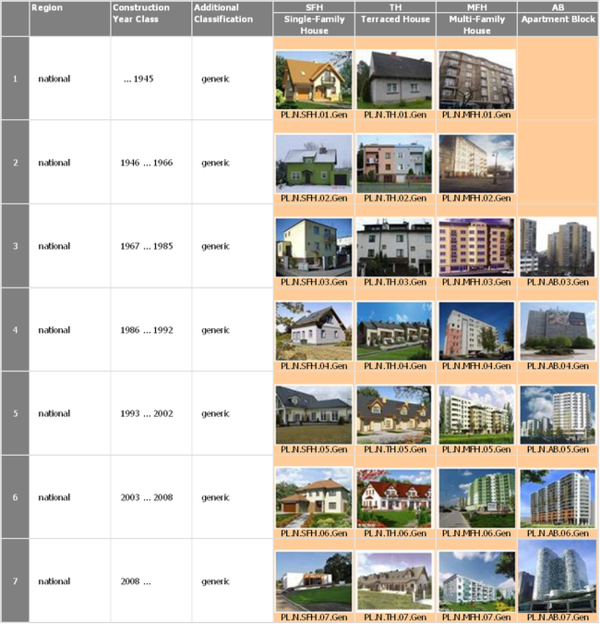
Building Type Matrix
classification scheme for residential buildings --- construction year classes --- pictures of example buildings
(►explanations)
Generic Building Types
Last updated: 04.11.2011
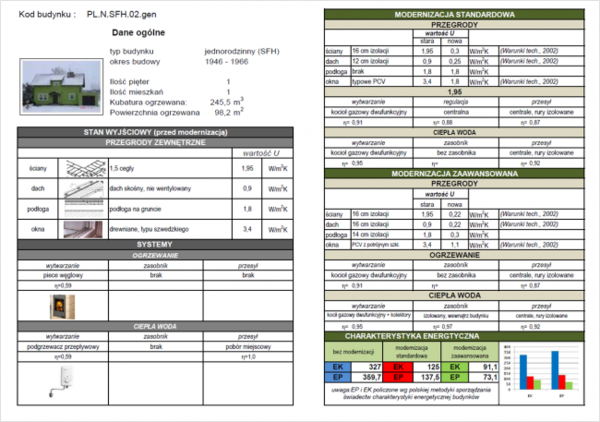
National Typology Brochure
example buildings --- typical energy consumption values --- effect of refurbishment measures --- building display sheets
(►explanations)
Brochure in Polish language. (Click on picture to download PDF)
Last updated: 01.02.2012
Statistics of the Polish Building Stock
systematical overview --- available statistics for residential buildings and heat supply systems
(►explanations)
Overview
| Statistical Table | Item | Available | Sources |
| S-1.1 | Frequency of building types of the national building stock | yes | |
| S-1.2.1 | Percentage of thermally refurbished envelope areas | yes | |
| S-1.2.2 | Information on insulation level and window types | ||
| S-2.1 | Centralisation of the heat supply (for space heating) | yes | |
| S-2.2 | Heat distribution and storage of space heating systems | ||
| S-2.3 | Heat generation of space heating systems | yes | |
| S-2.4 | Heat distribution and storage of domestic hot water systems | ||
| S-2.5 | Heat generation of domestic hot water systems | ||
| S-2.6 | Solar thermal systems | yes | |
| S-2.7 | Ventilation systems | ||
| S-2.8 | Air-conditioning systems | ||
| S-2.9 | Control of central heating systems |
Statistic S-1.1: Frequency of Building Types of the National Building Stock
| construction period |
number of buildings |
number of apartments |
living space (1000 m²) |
Tabula reference (1000 m²) |
|
| SFH | up to 1944 | 865.913 | 865.913 | 69.424.228 | 63.870.290 |
| 1945-1970 | 1.168.340 | 1.168.340 | 95.621.198 | 87.971.502 | |
| 1971-2002 | 1.831.142 | 1.831.142 | 218.138.583 | 200.687.496 | |
| 2002-2010 | 496.269 | 496.269 | 59.552.280 | 456.671 | |
| TH | up to 1944 | 156.206 | 312.412 | 20.486.590 | 18.847.663 |
| 1945-1970 | 114.042 | 228.084 | 14.889.989 | 13.698.790 | |
| 1971-2002 | 108.890 | 217.780 | 16.676.935 | 15.342.780 | |
| 2002-2010 | 4.487 | 308.974 | 27.807.660 | 15.065.572 | |
| MFH1 | up to 1944 | 176.859 | 867.558 | 46.506.695 | 40.460.825 |
| 1945-1970 | 42.166 | 200.347 | 10.343.469 | 8.998.818 | |
| 1971-2002 | 32.310 | 160.784 | 9.487.010 | 8.253.699 | |
| 2002-2010 | 33.370 | 286.507 | 21.488.025 | 13.958.621 | |
| MFH2 | up to 1944 | 42.444 | 700.719 | 35.462.223 | 30.852.134 |
| 1945-1970 | 42.994 | 1.574.491 | 67.325.934 | 58.573.563 | |
| 1971-2002 | 85.965 | 3.585.142 | 185.664.884 | 161.528.449 | |
| 2002-2010 | 13.931 | 617.800 | 43.246.000 | 27.949.272 | |
| total | 5.215.328 | 13.422.262 | 942.121.703 | 766.516.144 | |
| SFH | single family house with 1 apartment | ||||
| TH | terace house with 2 apartments | ||||
| MFH1 | small multifamily house with 3-9 apartments | ||||
| MFH2 | large multifamilty house with over 9 apartments | ||||
living space area based on external dimensions
conversion factor for Tabula reference area:
- SFH and TH: 0,92
- MFH: 0,87
Statistic S-1.2.1: Percentage of Thermally Refurbished Envelope Areas
| construction period | percent of thermomodernised buildings |
| up to 1945 | 7% |
| 1946-1966 | 52% |
| 1967-1985 | 60% |
| 1986-1992 | 41% |
| 1993-2002 | 30% |
| 2002-2008 | new buidlings fulfiled as obligatory energy eficient standards |
| after 2008 | new buidlings fulfiled as obligatory energy eficient standards |
Statistic S-1.2.2: Information on Insulation Level and Window types
Typical insulation thicknesses currently used for the purpose of thermomodernisation:
| walls | 14 | cm |
| roofs / upper floor ceilings | 15 | cm |
| basement / cellar ceiling | 8 | cm |
| windows U value | 1,3 | W/m2*K |
| doors | 2,0 | W/m2*K |
Statistic S-2.1: Centralisation of the Heat Supply (for Space Heating)
| construction period | number of buildings |
number of apartments |
living space (1000 m²) |
Tabula reference (1000 m²) |
|
| SFH | up to 1944 | 865.913 | 865.913 | 69.424.228 | 63.870.290 |
| 1945-1970 | 1.168.340 | 1.168.340 | 95.621.198 | 87.971.502 | |
| 1971-2002 | 1.831.142 | 1.831.142 | 218.138.583 | 200.687.496 | |
| 2002-2010 | 496.269 | 496.269 | 59.552.280 | 456.671 | |
| TH | up to 1944 | 156.206 | 312.412 | 20.486.590 | 18.847.663 |
| 1945-1970 | 114.042 | 228.084 | 14.889.989 | 13.698.790 | |
| 1971-2002 | 108.890 | 217.780 | 16.676.935 | 15.342.780 | |
| 2002-2010 | 4.487 | 308.974 | 27.807.660 | 15.065.572 | |
| MFH1 | up to 1944 | 176.859 | 867.558 | 46.506.695 | 40.460.825 |
| 1945-1970 | 42.166 | 200.347 | 10.343.469 | 8.998.818 | |
| 1971-2002 | 32.310 | 160.784 | 9.487.010 | 8.253.699 | |
| 2002-2010 | 33.370 | 286.507 | 21.488.025 | 13.958.621 | |
| MFH2 | up to 1944 | 42.444 | 700.719 | 35.462.223 | 30.852.134 |
| 1945-1970 | 42.994 | 1.574.491 | 67.325.934 | 58.573.563 | |
| 1971-2002 | 85.965 | 3.585.142 | 185.664.884 | 161.528.449 | |
| 2002-2010 | 13.931 | 617.800 | 43.246.000 | 27.949.272 | |
| total | 5.215.328 | 13.422.262 | 942.121.703 | 766.516.144 | |
Statistic S-2.3: Heat Generation of Space Heating Systems
|
construction period | distric heating | local heating systems | appartment heating systems | |||||||||||
| energy carrier | coal | gas | oil | others | coal | gas | oil | el. | others | coal | gas | oil | el. | others | |
| SFH | up to 1944 | 98% | 2% | 0% | 0% | 20% | 65% | 10% | 0% | 5% | 50% | 25% | 15% | 1% | 9% |
| 1945-1970 | 98% | 2% | 0% | 0% | 12% | 75% | 7% | 0% | 6% | 45% | 28% | 10% | 5% | 12% | |
| 1971-2002 | 98% | 2% | 0% | 0% | 7% | 80% | 8% | 0% | 5% | 35% | 32% | 8% | 11% | 14% | |
| 2002-2010 | 98% | 2% | 0% | 0% | 5% | 85% | 5% | 0% | 5% | 25% | 45% | 8% | 15% | 7% | |
| TH | up to 1944 | 98% | 2% | 0% | 0% | 15% | 65% | 15% | 0% | 5% | 50% | 25% | 15% | 1% | 9% |
| 1945-1970 | 98% | 2% | 0% | 0% | 13% | 76% | 6% | 0% | 5% | 45% | 28% | 10% | 5% | 12% | |
| 1971-2002 | 98% | 2% | 0% | 0% | 3% | 90% | 5% | 0% | 2% | 35% | 32% | 8% | 11% | 14% | |
| 2002-2010 | 98% | 2% | 0% | 0% | 1% | 92% | 5% | 0% | 2% | 25% | 45% | 8% | 15% | 7% | |
| MFH1 | up to 1944 | 98% | 2% | 0% | 0% | 18% | 65% | 12% | 0% | 5% | not used | ||||
| 1945-1970 | 98% | 2% | 0% | 0% | 13% | 72% | 10% | 0% | 5% | ||||||
| 1971-2002 | 98% | 2% | 0% | 0% | 3% | 89% | 6% | 0% | 2% | ||||||
| 2002-2010 | 98% | 2% | 0% | 0% | 1% | 91% | 5% | 0% | 3% | ||||||
| MFH2 | up to 1944 | 98% | 2% | 0% | 0% | 18% | 65% | 12% | 0% | 5% | not used | ||||
| 1945-1970 | 98% | 2% | 0% | 0% | 13% | 72% | 10% | 0% | 5% | ||||||
| 1971-2002 | 98% | 2% | 0% | 0% | 3% | 89% | 6% | 0% | 2% | ||||||
| 2002-2010 | 98% | 2% | 0% | 0% | 1% | 91% | 5% | 0% | 3% | ||||||
S-2.4
|
|
construction period | DHW | coal boilers | gas boilers | oli boilers | electric | others |
| SFH | up to 1944 | 7 % | 54 % | 20 % | 16 % | 1 % | 2 % |
| 1945-1970 | 8 % | 50 % | 22 % | 14 % | 5 % | 1 % | |
| 1971-2002 | 12 % | 40 % | 25 % | 11 % | 11 % | 1 % | |
| 2002-2010 | 12 % | 25 % | 28 % | 10 % | 20 % | 5 % | |
| TH | up to 1944 | 5 % | 54 % | 22 % | 16 % | 1 % | 2 % |
| 1945-1970 | 10 % | 50 % | 22 % | 12 % | 5 % | 1 % | |
| 1971-2002 | 10 % | 40 % | 27 % | 11 % | 11 % | 1 % | |
| 2002-2010 | 15 % | 25 % | 28 % | 10 % | 20 % | 2 % | |
| MFH1 | up to 1944 | 58 % | 2 % | 20 % | 0 % | 20 % | - |
| 1945-1970 | 73 % | 2 % | 21 % | - | 4 % | - | |
| 1971-2002 | 90 % | 0 % | 8 % | - | 2 % | - | |
| 2002-2010 | 85 % | - | 13 % | - | 2 % | - | |
| MFH2 | up to 1944 | 60 % | 1 % | 22 % | 2 % | 12 % | 3 % |
| 1945-1970 | 68 % | - | 28 % | - | 4 % | - | |
| 1971-2002 | 70 % | - | 25 % | - | 5 % | - | |
| 2002-2010 | 72 % | - | 20 % | - | 8 % | - |
Statistic S-2.6: Solar Thermal Systems
| with solar systems | without solar systems | |
| SFH | 2 % | 99 % |
| TH | 1 % | 99 % |
| MFH1 | 1 % | 100 % |
| MFH2 | 0 % | 100 % |
National Scientific Report Poland
Fundamentals and elements of the national residential building typology
Download:<PL_TABULA_ScientificReport_NAPE.pdf>
(in English Language)
Last updated: 22.02.2012
| Responsible for the content of this page: NAPE - National Energy Conservation Agency (contact information) |
