


- >
- Building Typology>
- COUNTRY PAGES>
- ES Spain
ES Spain - Country Page
National Contact Point
| Information in Spanish language: | National Contact Point Spain (EPISCOPE) |
| TABULA Building Typology Spain |
Residential Building Typology
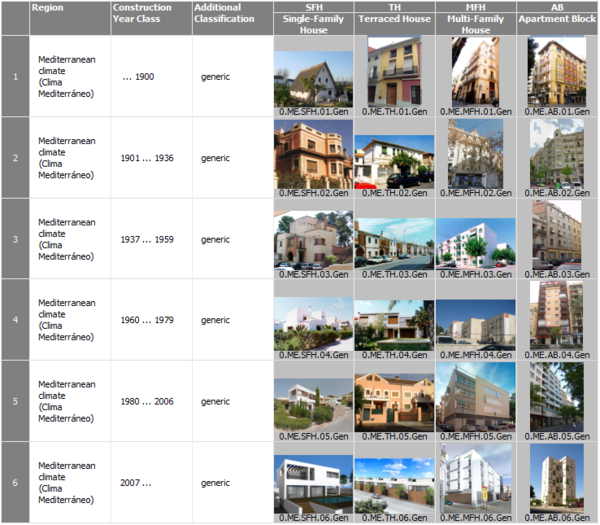
Building Type Matrix
classification scheme for residential buildings --- construction year classes --- pictures of example buildings
(►explanations)
Mediterranean Climate
Last updated: 05.09.2014
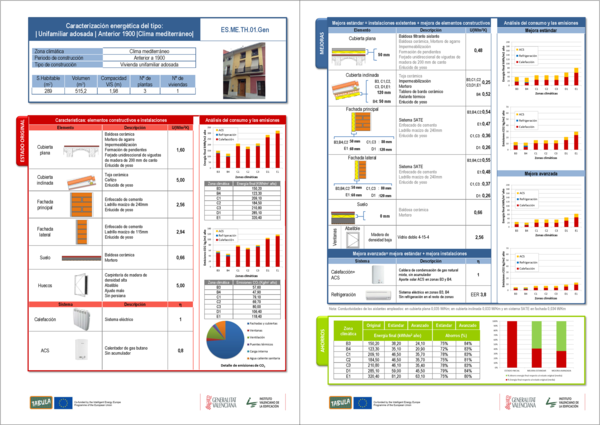
National Typology Brochure
example buildings --- typical energy consumption values --- effect of refurbishment measures --- building display sheets
(►explanations)
Brochure in Spanish language. (Click on picture to download PDF.)
Last updated: 19.07.2016
Statistics of the Spanish Building Stock
systematical overview --- available statistics for residential buildings and heat supply systems
(►explanations)
Last updated: 07.11.2013
Overview
|
Statistical Table |
Item |
Available |
Sources |
|
S-1.1 |
Frequency of building types |
yes |
[1] |
|
S-1.2 |
State of Modernization |
||
|
S-1.2.1 |
Modernized Building Elements |
||
|
S-1.2.2 |
Modernization Quality |
||
|
S-2.1 |
Centralization of Heating Systems |
yes |
[1] |
|
S-2.2 |
Heat Distribution (Space Heating) |
||
|
S-2.3 |
Heat Generation (Space Heating) |
||
|
S-2.3.1 |
Energy carrier |
yes |
[1] |
|
S-2.3.2 |
Installation year |
yes |
[2] |
|
S-2.3.3 |
Type of heat generator |
yes |
[2] |
|
S-2.4 |
Heat distribution / Storage (Hot Water) |
||
|
S-2.5 |
Heat Generation (Hot Water) |
yes |
[2] |
|
S-2.6 |
Solar Thermal Systems |
yes |
[2] |
|
S-2.7 |
Ventilation Systems |
||
|
S-2.8 |
Air Conditioning Systems |
yes |
[1] [2] |
|
S-2.9 |
Control of Central Heating Systems |
||
|
S-2.10 |
Correlation of Envelope an Heat Supply Modernization |
||
| S-3.1 | Domestic energy consumption | yes | [3] |
[1] Source: INE (National Statistical Institute) 2001
[2] Source: IDAE (Institute for energy diversification and Saving) 2012
[2] Source: IDAE (Institute for energy diversification and Saving) 2011
Last updated: 07.11.2013
S-1.1 Frequency of Building Types of the National Building Stock
2001 data
| Single unit houses (1 apartment) |
Multi unit houses (≥ 2 apartments) |
Building Stock total | |||
| Number of buildings= Number of apartments | Number of buildings | Number of apartments | Number of buildings | Number of apartments | |
| Before 1900 | 767.656 | 132.086 | 554.412 | 899.742 | 554.412 |
| 11% | 7% | 4% | 10% | 4% | |
| 1900-1920 | 354.954 | 71.292 | 369.027 | 426.246 | 369.027 |
| 5% | 4% | 3% | 5% | 3% | |
| 1921-1940 | 405.196 | 91.147 | 498.539 | 496.343 | 498.539 |
| 6% | 5% | 4% | 6% | 4% | |
| 1941-1950 | 435.942 | 102.782 | 548.948 | 538.724 | 548.948 |
| 7% | 5% | 4% | 6% | 4% | |
| 1951-1960 | 679.882 | 205.484 | 1.305.565 | 885.366 | 1.305.565 |
| 10% | 11% | 9% | 10% | 9% | |
| 1961-1970 | 761.201 | 327.792 | 2.910.774 | 1.088.993 | 2.910.774 |
| 11% | 17% | 21% | 13% | 21% | |
| 1971-1980 | 1.084.141 | 418.935 | 3.888.633 | 1.503.076 | 3.888.633 |
| 16% | 22% | 27% | 17% | 27% | |
| 1981-1990 | 1.096.051 | 262.965 | 1.781.978 | 1.359.016 | 1.781.978 |
| 16% | 14% | 13% | 16% | 13% | |
| 1991-2001 | 1.097.568 | 318.342 | 2.282.988 | 1.415.910 | 2.282.988 |
| 16% | 16% | 16% | 16% | 16% | |
| Total | 6.682.591 | 1.930.825 | 14.140.864 | 8.613.416 | 20.823.455 |
2011 data
| Building TYPE | Number of buildings | Number of apartments |
| Building Stock total |
9.804.090 |
25.208.623 |
Last updated: 07.11.2013
Dwellings by number of rooms
| 1 room |
2 rooms |
3 rooms |
4 rooms |
5 rooms |
6 rooms |
7 rooms |
8 rooms |
9 rooms |
10 or more |
|
| Number of dwellings |
77.431 | 34.6131 | 136.0974 | 2.838.537 | 5.413.152 | 2.811.754 | 742.915 | 321.495 | 131.370 | 143.410 |
Total dwellings by type of building from different periods
| Before 1900 | 1900-1920 | 1921-1940 | 1941-1950 | 1951-1960 | 1961-1970 | 1971-1980 | 1981-1990 | 1991-2001 | ||||||||||
| Single Unit Houses | 767.656 | 11% | 354.954 | 5% | 405.196 | 6% | 435.942 | 7% | 679.882 | 10% | 761.201 | 11% | 1.084.141 | 16% | 1.096.051 | 16% | 1.097.568 | 16% |
| Multi Unit Houses | 554.412 | 4% | 369.027 | 3% | 498.539 | 4% | 548.948 | 4% | 1.305.565 | 9% | 2.910.774 | 21% | 3.888.633 | 27% | 1.781.978 | 13% | 2.282.988 | 16% |
| Total | 554.412 | 4% | 369.027 | 3% | 498.539 | 4% | 548.948 | 4% | 1.305.565 | 9% | 2.910.774 | 21% | 3.888.633 | 27% | 1.781.978 | 13% | 2.282.988 | 16% |
Total buildings by type and year of construction
| Before 1900 | 1900-1920 | 1921-1940 | 1941-1950 | 1951-1960 | 1961-1970 | 1971-1980 | 1981-1990 | 1991-2001 | ||||||||||
| Single Unit Houses | 767.656 | 11% | 354.954 | 5% | 405.196 | 6% | 435.942 | 7% | 679.882 | 10% | 761.201 | 11% | 1.084.141 | 16% | 1.096.051 | 16% | 1.097.568 | 16% |
| Multi Unit Houses | 132.086 | 7% | 71.292 | 4% | 91.147 | 5% | 102.782 | 5% | 205.484 | 11% | 327.792 | 17% | 418.935 | 22% | 262.965 | 14% | 318.342 | 16% |
| Total | 899.742 | 10% | 426.246 | 5% | 496.343 | 6% | 538.724 | 6% | 885.366 | 10% | 1.088.993 | 13% | 1.503.076 | 17% | 1.359.016 | 16% | 1.415.910 | 16% |
Number of buildings to construct, rehabilitate or demolish
|
Buildings to construct |
Buildings to rehabilitate |
Buildings to demolish |
||
|
Residential |
Non-residential |
|||
|
2005 |
184.218 |
19.159 |
33.086 |
20.997 |
|
2006 |
208.631 |
21.413 |
35.856 |
28.480 |
|
2007 |
166.322 |
20.825 |
33.359 |
26.141 |
|
2008 |
79.752 |
13.926 |
34.807 |
14.573 |
|
2009 |
39.564 |
12.180 |
33.267 |
7.984 |
Average age of residential buildings by Autonomous Communities
|
Autonomous Communities |
Single Unit Houses |
Multi Unit Houses |
|
Andalucía |
19 |
15 |
|
Aragón |
28 |
16 |
|
Asturias |
34 |
17 |
|
Balears |
20 |
13 |
|
Canarias |
21 |
14 |
|
Cantabria |
29 |
17 |
|
Castilla y León |
28 |
16 |
|
Castilla-La Mancha |
23 |
14 |
|
Cataluña |
17 |
20 |
|
Comunidad Valenciana |
21 |
15 |
|
Extremadura |
23 |
14 |
|
Galicia |
32 |
15 |
|
Madrid |
12 |
16 |
|
Murcia |
22 |
14 |
|
Navarra |
26 |
17 |
|
País Vasco |
29 |
19 |
|
La Rioja |
28 |
15 |
|
Total |
24 |
15 |
Statistic S-2.1: Centralisation of the Heat Supply (for Space Heating)
| Before 1900 | 1900 - 1920 | 1921 - 1940 | 1941 - 1950 | 1951 - 1960 | 1961 - 1970 | 1971 - 1980 | 1981 - 1990 | 1991 - 2001 | Total | ||
|
Single unit houses ment) |
Room heating systems | 50% | 52% | 50% | 49% | 47% | 46% | 42% | 37% | 32% | 42% |
| Apartment heating systems | 25% | 22% | 24% | 26% | 29% | 30% | 36% | 45% | 52% | 36% | |
| Building heating system | 1% | 1% | 1% | 1% | 2% | 2% | 2% | 2% | 3% | 2% | |
| Without heating system | 24% | 24% | 24% | 24% | 22% | 22% | 20% | 15% | 13% | 19% | |
|
Multi unit houses ments) |
Room heating systems | 46% | 46% | 43% | 41% | 41% | 40% | 35% | 29% | 23% | 35% |
| Apartment heating systems | 35% | 34% | 35% | 36% | 36% | 36% | 35% | 44% | 59% | 40% | |
| Building heating system | 5% | 6% | 10% | 10% | 10% | 12% | 18% | 15% | 8% | 13% | |
| Without heating system | 14% | 14% | 13% | 14% | 14% | 13% | 13% | 12% | 10% | 12% | |
| Building Stock total | Room heating systems | 48% | 49% | 46% | 44% | 43% | 41% | 36% | 32% | 26% | 38% |
| Apartment heating systems | 30% | 29% | 30% | 32% | 34% | 35% | 35% | 45% | 56% | 39% | |
| Building heating system | 3% | 4% | 6% | 6% | 7% | 10% | 15% | 10% | 6% | 9% | |
| Without heating system | 20% | 18% | 18% | 18% | 16% | 14% | 14% | 13% | 11% | 15% |
Last updated: 07.11.2013
Statistic S-2.3: Heat Generation of Space Heating Systems
| Number of dwellings |
Before 1900 | 1900- 1920 |
1921- 1940 |
1941- 1950 |
1951- 1960 |
1961- 1970 |
1971- 1980 |
1981- 1990 |
1991- 2001 |
| Gas | 194.822 | 128.698 | 181.892 | 191.891 | 445.965 | 925.240 | 1.118.434 | 583.567 | 918.644 |
| Electricity | 212.026 | 137.888 | 181.744 | 203.075 | 469.054 | 942.000 | 1.094.406 | 595.262 | 631.959 |
| Petroleum or derivates |
108.609 | 47.396 | 63.601 | 71.973 | 147.092 | 287.215 | 562.001 | 370.890 | 322.740 |
| Wood | 54.078 | 22.160 | 24.121 | 24.615 | 36.920 | 43.851 | 54.794 | 54.798 | 42.326 |
| Coal or derivates |
76.215 | 32.425 | 38.741 | 41.043 | 67.862 | 88.391 | 88.783 | 60.311 | 38.603 |
| Others | 3.441 | 2.001 | 2.166 | 2.515 | 5.040 | 8.954 | 11.720 | 5.847 | 5.095 |
| Before 1900 | 1900 - 1920 | 1921 - 1940 | 1941 - 1950 | 1951 - 1960 | 1961 - 1970 | 1971 - 1980 | 1981 - 1990 | 1991 - 2001 | Total | ||
|
Single unit houses ment) |
Room heating systems |
50% | 52% | 50% | 49% | 47% | 46% | 42% | 37% | 32% | 42% |
|
Apartment heating systems |
25% | 22% | 24% | 26% | 29% | 30% | 36% | 45% | 52% | 36% | |
|
Building heating system |
1% | 1% | 1% | 1% | 2% | 2% | 2% | 2% | 3% | 2% | |
|
Without heating system |
24% | 24% | 24% | 24% | 22% | 22% | 20% | 15% | 13% | 19% | |
|
Multi unit houses ments) |
Room heating systems |
46% | 46% | 43% | 41% | 41% | 40% | 35% | 29% | 23% | 35% |
|
Apartment heating systems |
35% | 34% | 35% | 36% | 36% | 36% | 35% | 44% | 59% | 40% | |
|
Building heating system |
5% | 6% | 10% | 10% | 10% | 12% | 18% | 15% | 8% | 13% | |
|
Without heating system |
14% | 14% | 13% | 14% | 14% | 13% | 13% | 12% | 10% | 12% | |
| Building Stock total |
Room heating systems |
48% | 49% | 46% | 44% | 43% | 41% | 36% | 32% | 26% | 38% |
|
Apartment heating systems |
30% | 29% | 30% | 32% | 34% | 35% | 35% | 45% | 56% | 39% | |
|
Building heating system |
3% | 4% | 6% | 6% | 7% | 10% | 15% | 10% | 6% | 9% | |
|
Without heating system |
20% | 18% | 18% | 18% | 16% | 14% | 14% | 13% | 11% | 15% |
Last updated: 07.11.2013
S-2.3.1: Heat Generation of Space Heating Systems, Energy Carrier
| Before 1900 | 1900 - 1920 | 1921 - 1940 | 1941 - 1950 | 1951 - 1960 | 1961 - 1970 | 1971 - 1980 | 1981 - 1990 | 1991 - 2001 | ||
|
Single unit houses ment) |
Gas |
18% | 21% | 22% | 21% | 23% | 21% | 20% | 23% | 31% |
|
Electricity |
26% | 31% | 33% | 35% | 37% | 39% | 35% | 35% | 33% | |
|
Petroleum or derivates |
22% | 18% | 19% | 20% | 21% | 23% | 28% | 29% | 27% | |
|
Wood |
14% | 12% | 11% | 10% | 8% | 8% | 7% | 7% | 5% | |
|
Coal or derivates |
19% | 17% | 15% | 13% | 11% | 10% | 9% | 6% | 4% | |
|
Others |
1% | 1% | 1% | 1% | 1% | 0% | 1% | 0% | 0% | |
|
Multi unit houses ments) |
Gas |
45% | 42% | 45% | 46% | 44% | 44% | 44% | 42% | 42% |
|
Electricity |
38% | 39% | 42% | 39% | 40% | 41% | 42% | 38% | 36% | |
|
Petroleum or derivates |
13% | 11% | 9% | 9% | 10% | 9% | 10% | 17% | 18% | |
|
Wood |
1% | 2% | 2% | 1% | 1% | 1% | 1% | 1% | 1% | |
|
Coal or derivates |
2% | 4% | 3% | 4% | 5% | 4% | 3% | 2% | 2% | |
|
Others |
0% | 0% | 0% | 0% | 0% | 0% | 0% | 0% | 0% | |
| Building Stock total |
Gas |
30% | 35% | 37% | 36% | 38% | 40% | 38% | 35% | 47% |
|
Electricity |
33% | 37% | 37% | 38% | 40% | 41% | 37% | 36% | 32% | |
|
Petroleum or derivates |
17% | 13% | 13% | 13% | 13% | 13% | 19% | 22% | 16% | |
|
Wood |
8% | 6% | 5% | 5% | 3% | 2% | 2% | 3% | 2% | |
|
Coal or derivates |
12% | 9% | 8% | 8% | 6% | 4% | 3% | 4% | 2% | |
|
Others |
1% | 1% | 0% | 0% | 0% | 0% | 0% | 0% | 0% |
Last updated: 07.11.2013
S-2.3.2: Heat Generation of Space Heating Systems, Installation Year
| Building Stock total | The average age (years) |
| Non- Condensing boiler | 10 |
| Condensing Boiler | 5,6 |
| Non-reversible heat pump | 6,6 |
| Reversible heat pump | 5,6 |
| Total | 8,4 |
Last updated: 08.11.2013
S-2.3.3: Heat Generation of Space Heating Systems, Type
|
|
Single unit houses (1 apartment) |
Multi unit houses (≥ 2 apartments) |
Building Stock total |
| Non- Condensing boiler | 34% | 39% | 38% |
| Condensing Boiler | 0% | 1% | 1% |
| Non-reversible heat pump | 16% | 16% | 16% |
| Reversible heat pump | 0% | 0% | 0% |
| Electric Radiator / Convector / accumulator | 16% | 18% | 17% |
| Solar panels | 0% | 1% | 1% |
| Portable Electric Heater / Radiator | 20% | 17% | 18% |
| Portable non-Electric Heater / Radiator | 6% | 3% | 4% |
| Other | 8% | 5% | 6% |
| Total | 100% | 100% | 100% |
Last updated: 08.11.2013
| Athlantic climatic zone | Continental climatic zone | Mediterranean climatic zone | Building Stock total | |
| Non-Condensing boiler | 50% | 61% | 21% | 38% |
| Condensing Boiler | 1% | 2% | 1% | 1% |
| Non-reversible heat pump | 0% | 7% | 25% | 16% |
| Reversible heat pump | 1% | 0% | 0% | 0% |
| Electric Radiator / Convector / accumulator | 21% | 12% | 20% | 17% |
| Solar panels | 1% | 1% | 1% | 1% |
| Portable Electric Heater / Radiator | 14% | 9% | 24% | 18% |
| Portable non-Electric Heater / Radiator | 4% | 3% | 4% | 4% |
| Other | 6% | 6% | 6% | 6% |
| Total | 100% | 100% | 100% | 100% |
Last updated: 08.11.2013
S-2.5: Heat Generation of Domestic Hot Water Systems
| Single unit houses (1 apartment) |
Multi unit houses (≥ 2 apartments) |
Building Stock total | |
| Centralized boiler | 1% | 4% | 3% |
| Individual bolier | 49% | 48% | 48% |
| Non-Condensing boiler | 32% | 32% | 32% |
| Electric immersion heater | 16% | 15% | 15% |
| Stoves | 1% | 1% | 1% |
| Condensing boiler | 1% | 1% | 1% |
| Solar panels | 2% | 0% | 1% |
| Total | 100% | 100% | 100% |
| Athlantic climatic zone | Continental climatic zone | Mediterranean climatic zone | Building Stock total | |
| Centralized boiler | 6% | 13% | 1% | 6% |
| Individual boiler | 94% | 87% | 96% | 93% |
| Non-Condensing boiler | 71% | 66% | 56% | 61% |
| Electric immersion heater | 20% | 18% | 38% | 29% |
| Stoves | 1% | 1% | 2% | 1% |
| Condensing boiler | 2% | 2% | 1% | 2% |
| Solar panels | 0% | 1% | 2% | 1% |
| Total | 100% | 100% | 100% | 100% |
Last updated: 08.11.2013
S-2.6: Solar Thermal Systems
|
|
Single unit houses (1 apartment) |
Multi unit houses (≥ 2 apartments) |
Building Stock total |
| Solar panels for heating | 72.679 | 82.117 | 154.797 |
| Solar panels for DHW | 187.196 | 36.399 | 223.595 |
&nbs
|
|
Athlantic climatic zone | Continental climatic zone | Mediterranean climatic zone | Building Stock total |
| Solar panels for heating | 28.344 | 68.805 | 57.648 | 154.797 |
| Solar panels for DHW | 2.253 | 28.914 | 192.428 | 223.595 |
Last updated: 08.11.2013
S-2.8: Air-conditioning Systems
| Before 1900 | 1900-1920 | 1921-1940 | 1941-1950 | 1951-1960 | 1961-1970 | 1971-1980 | 1981-1990 | 1991-2001 | ||
| Single unit houses (1 apartment) |
There is air condition system | 3% | 4% | 5% | 7% | 8% | 10% | 12% | 18% | 18% |
| There is no air condition system | 97% | 96% | 95% | 93% | 92% | 90% | 88% | 82% | 82% | |
| Multi unit houses (≥ 2 apartments) |
There is air condition system | 11% | 13% | 15% | 14% | 15% | 16% | 18% | 20% | 21% |
| There is no air condition system | 89% | 87% | 85% | 86% | 85% | 84% | 82% | 80% | 79% | |
| Building Stock total | There is air condition system | 7% | 9% | 11% | 11% | 13% | 15% | 17% | 19% | 20% |
| There is no air condition system | 93% | 91% | 89% | 89% | 87% | 85% | 83% | 81% | 80% |
Last updated: 08.11.2013
| Single unit houses (1 apartment) |
Multi unit houses (≥ 2 apartments) |
Building Stock total | |
| Portable appliance | >4% | >7% | >6% |
| Non-Portable appliance | >12% | >17% | >16% |
| Heat Pump | >84% | >76% | >78% |
| Total | >100% | >100% | >100% |
| Athlantic climatic zone | Continental climatic zone | Mediterranean climatic zone | Building Stock total | |
| Portable appliance | >67% | >9% | >5% | >6% |
| Non-Portable appliance | >5% | >25% | >12% | >16% |
| Heat Pump | >28% | >66% | >83% | >78% |
| Total | >100% | >100% | >100% | >100% |
Last updated: 08.11.2013
Statistic S-3.1: Domestic energy consumption
ANNUAL ENERGY CONSUMPTION. COMMERCIAL UNITS. 2010
Final Energy Consumption: Residential / Household Sector
| Use | Coal | Petroleum Products | Gases | Renewable energy | Electric power | TOTAL | Total Consumption according uses |
||||||
| LPG | Liquid Fuels | TOTAL Petroleum Products | Biomass | Solar | Geothermal | TOTAL Renewable | Thermal | Electric | |||||
| Unit: | ktep | ktep | ktep | ktep | ktep | ktep | ktep | ktep | ktep | ktep | ktep | ktep | ktep |
| Heating | 12 | 388 | 2.033 | 2.421 | 1.695 | 2.368 | 10 | 6,06 | 2.384 | 380 | 6.892 | 6.513 | 380 |
| DHW | 1 | 459 | 183 | 642 | 1.566 | 50 | 129,0 | 3,42 | 183 | 385 | 2.776 | 2.391 | 385 |
| Kitchen | 2 | 185 | -- | 185 | 399 | 26 | -- | -- | 26 | 479 | 1.090 | 611 | 479 |
| Lighting | -- | -- | -- | -- | -- | -- | -- | -- | -- | 606 | 606 | -- | 606 |
| Cooling | -- | -- | -- | -- | -- | -- | -- | 2,55 | 3 | 120 | 123 | 3 | 120 |
| Appliances | -- | -- | -- | -- | -- | -- | -- | -- | -- | 3.188 | 3.188 | -- | 3.188 |
| TOTAL HOUSEHOLD CONSUMPTION | 15 | 1.032 | 2.216 | 3.247 | 3.660 | 2.444 | 139 | 12,04 | 2.595 | 5.159 | 14.676 | 9.517 | 5.159 |
| RESIDENTIAL TOTAL CONSUMPTION | 173 | 1.386 | 1.983 | 3.369 | 4.257 | 2.464 | 144 | 9,03 | 2.617 | 6.508 | 16.924 | 10.416 | 6.508 |
| Δ 2010/2009 | -10,0% | 0,6% | 1,2% | 0,9% | 15,5% | 0,8% | 20,5% | 18,9% | 1,8% | 6,0% | 6,3% | 6,4% | 6,0% |
Note: Excludes non-energy uses
Source:MINETUR/IDAE/INE
Additional statistics of the Spanish building stock
Household Consumption In Spain
Total Consumption: 14,676 ktep
Total average consumption per household: 0.852 tep
Medium Electricity Consumption Per Household: 3,487 kWh
Average Consumption By Type Of Housing
Single unit houses (1 apartment): 1.334 tep
Multi unit houses (≥ 2 apartments): 0.649 tep
Average Consumption By Climate Zone
North Atlantic climate: 0.799 tep
Continental climate: 1.087 tep
Mediterranean climate: 0.719 tep
Structure Of Total Consumption (%) By Energy Sources
Electricity: 35,1 %
Natural gas: 24,9 %
LPG: 22,1 %
Renewable energy: 17,7 %
Coal: 0,1 %
Source: IDAE (Institute for energy diversification and Saving) 2011
Last updated: 02.09.2014
Distribution of households in Spain
|
Athlantic climatic zone |
Continental climatic zone |
Mediterranean climatic zone |
Building Stock total |
|
| Number of households | 2,253,421 | 5,782,834 | 9,163,375 | 17,199,630 |
|
Single unit houses 1 apartment |
Multi unit houses >= 2 apartments |
Building Stock total |
|
| Number of households | 5,159,889 | 12,039,741 | 17,199,630 |
Household consumption in Spain by energy sources
| Units: ktep |
Athlantic climatic zone |
Continental climatic zone |
Mediterranean climatic zone |
Building Stock total |
| Coal | 11 | 3 | 0 | 15 |
| LPG | 173 | 259 | 601 | 1,032 |
| Oil | 228 | 1,479 | 509 | 2,216 |
| Natural gas | 474 | 1,762 | 1,425 | 3,66 |
| Solar thermal | 5 | 33 | 101 | 139 |
| Geothermal | 2 | 5 | 4 | 12 |
| Vegetal coal | 1 | 26 | 0 | 27 |
| Firewood | 233 | 963 | 1,195 | 2,392 |
| Pellets | 2 | 4 | 3 | 9 |
| Other solid biomass | 0 | 10 | 5 | 15 |
| Electricity | 672 | 1,74 | 2,747 | 5,159 |
| Total | 1,801 | 6,284 | 6,591 | 14,676 |
| Units: ktep |
Single unit houses |
Multi unit houses |
Building Stock total |
| Coal | 8 | 7 | 15 |
| LPG | 532 | 500 | 1,032 |
| Oil | 1,32 | 895 | 2,216 |
| Natural gas | 711 | 2,95 | 3,66 |
| Solar thermal | 132 | 8 | 139 |
| Geothermal | 12 | 0 | 12 |
| Vegetal coal | 27 | 0 | 27 |
| Firewood | 2,392 | 0 | 2,392 |
| Pellets | - | - | 9 |
| Other solid biomass | - | - | 15 |
| Electricity | 1,666 | 3,492 | 5,159 |
| Total | 6,8 | 7,851 | 14,676 |
Average consumption by household
| Units: tep/household |
Athlantic climatic zone |
Continental climatic zone |
Mediterranean climatic zone |
Building Stock total |
| Single unit houses 1 apartment |
1.289 | 1.690 | 1.139 | 0.649 |
| Multi unit houses >= 2 apartments |
0.628 | 0.842 | 0.527 | 1.334 |
| Spain | 0.799 | 1.087 | 0.719 | 0.853 |
| Units: kWh/household |
Athlantic climatic zone |
Continental climatic zone |
Mediterranean climatic zone |
Building Stock total |
| Single unit houses 1 apartment |
14,987 | 19,653 | 13,239 | 7,544 |
| Multi unit houses >= 2 apartments |
7,306 | 9,796 | 6,128 | 15,513 |
| Spain | 9,293 | 12,636 | 8,363 | 9,922 |
Source: IDAE (Institute for energy diversification and Saving) 2011
Last updated: 02.09.2014
National Typology Report Spain
building types --- construction types --- statistics
Download: <ES_TABULA_Report_IVE.pdf>
(in English language)
Last updated: 30.08.2013
| Responsible for the content of this page: IVE - Instituto Valenciano de la Edificación (contact information) |
