


- >
- Building Typology>
- COUNTRY PAGES>
- CY Cyprus
CY Cyprus - Country Page
National Contact Point
| Information in Greek language: | National Contact Point Cyprus |
Residential Building Typology
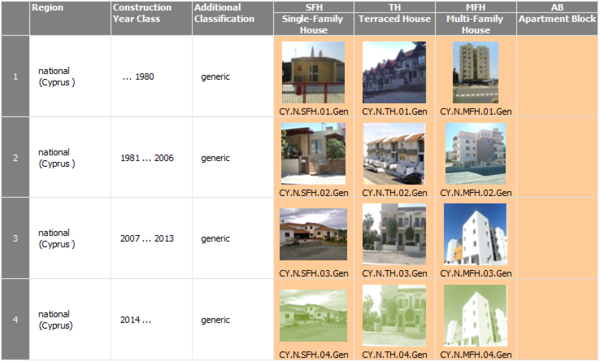
Building Type Matrix
classification scheme for residential buildings --- construction year classes --- pictures of example buildings
(►explanations)
Generic Building Types
Last updated: 02.09.2014
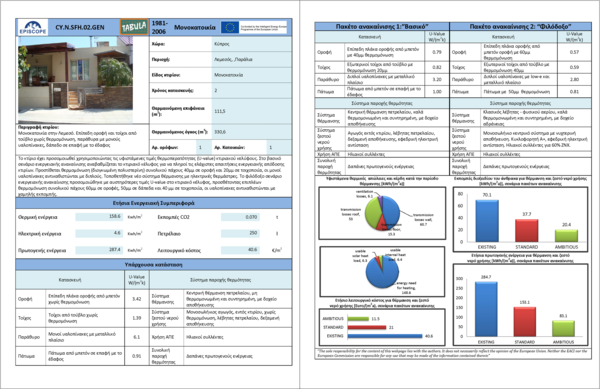
National Typology Brochure
example buildings --- typical energy consumption values --- effect of refurbishment measures --- building display sheets
(►explanations)
Brochure in Greek language. (Click on picture to download PDF.)
Last updated: 23.09.2014
Statistics of the Cyprus Building Stock
systematical overview --- available statistics for residential buildings and heat supply systems
(►explanations)
Overview
| Statistical Table | Item | Available | Sources |
| S-1.1 | Frequency of building types of the national building stock | yes | [1], [4] |
| S-1.2.1 | Percentage of thermally refurbished envelope areas | yes | [2] |
| S-1.2.2 | Information on insulation level and window types | yes | [2], [5] |
| S-2.1 | Centralisation of the heat supply (for space heating) | yes | [1], [2] |
| S-2.2 | Heat distribution and storage of space heating systems | no | |
| S-2.3.3 | Heat generation of space heating systems (type of heat generator) | yes | [1], [2] |
| S-2.4 | Heat distribution and storage of domestic hot water systems | no | |
| S-2.5 | Heat generation of domestic hot water systems | yes | [1], [2], [3] |
| S-2.6 | Solar thermal systems | yes | [1], [2] |
| S-2.7 | Ventilation systems | no | |
| S-2.8 | Air-conditioning systems | yes | [1], [2] |
| S-2.9 | Control of central heating systems | no | |
| S-2.10 | Correlation of envelope an heat supply modernization | no | |
| S-3.1 | Domestic energy consumption | yes | [1] |
[1] Source: Cyprus Statistical Service, Census 2011.
[2] Source: Buildings’ Typology Cyprus, Cyprus Energy Agency, May 2012
[3] Source: G.P. Panayiotou, S.A. Kalogirou, G.A. Florides, C.N. Maxoulis, A.M. Papadopoulos, M. Neophytou, P. Fokaides, G. Georgiou, A. Symeou, G. Georgakis, “The characteristics and the energy behaviour of the residential building stock of Cyprus in view of Directive 2002/91/EC”
[4] Source: Cyprus Land Development Corporation, Statistical data.
[5] Source: Energy Service of Cyprus
Last updated: 04.09.2014
Statistic S-1.1: Frequency of Building Types of the National Building Stock
| Construction Period | SFH single family houses |
TH Terrace houses |
MFH multi-family houses |
||||||||
| from | to |
No. of Buil- dings |
National sq. meters. |
TABULA ref. extdim) |
No. of Buil- dings |
National sq. meters. |
TABULA ref. (1000 m2) (0,85*A_C_ extdim) |
No. of Buil- dings |
National sq. meters. |
TABULA ref. (1000 m2 ) (0,85*A_C_ extdim) |
|
|
1 |
… | 1980 | 58524 | 7485301 | 6362.51 | 7874 | 773464 | 657.44 | 13524 | 1447645 | 1230.5 |
|
2 |
1981 | 2006 | 98025 | 17975224 | 15278.94 | 8277 | 928174 | 788.95 | 39366 | 4088088 | 3474.87 |
|
3 |
2007 | …. | 19278 | 3762191 | 3197.86 | 1670 | 201056 | 170.9 | 17236 | 1537614 | 1306.97 |
| TOTAL | 175827 | 29222716 | 24839.31 | 17821 | 1902694 | 1617.29 | 70126 | 7073347 | 6012.34 | ||
Last updated: 08.11.2013
Statistic S-1.2.1: Percentage of Thermally Refurbished Envelope Areas
| Percentages related to building numbers of the whole national building stock | |
| Percentage of modernized element area (with improved thermal protection) | |
| Walls’ insulation | 7.5 % |
| roofs / upper floor ceilings’ insulation | 5.5 % |
| basement / cellar ceiling insulation | 0.8 % |
| windows* | 43.2 % |
| Different | 0.4 % |
| No insulation | 54.4 % |
Last updated: 08.11.2013
Statistic S-1.2.2: Information on Insulation Level and Window Types
| Typical values for insulated buildings’ envelopes | |
| Brick wall(20 cm) with 3 cm insulation and plaster | 0.614 W/m²K |
| Beams and columns / reinforced concrete with 3 cm insulation | 0.808 W/m²K |
| Flat roofs / reinforced concrete with 5 cm insulation | 0.553 W/m²K |
| Floor / marble or ceramic with 5 cm insulation | 0.534 W/m²K 2,0 W/m²K |
| Double windows with aluminum frame | 3,7~3.8 W/m²K |
| Typical values for non-insulated buildings’ envelopes | |
| Brick wall 20 cm with plaster | 1,4 W/m²K |
| Beams and columns / reinforced concrete | 2,8 W/m²K |
| Flat roofs / reinforced concrete | 3,3 W/m²K |
| Floor / marble or ceramic | 2,0 W/m²K |
| Double windows with aluminum frame Single windows with aluminum frame | 6,0 W/m²K |
Last updated: 08.11.2013
Statistic S-2.1.1: Centralization of the Heat Supply (for Space Heating)
Percentages related to number of buildings for the whole national building stock
| Centralization of the heat supply | (%) |
| Central heating system | 29,3 |
| Room heating system | 69,1 |
| No heating system | 1,6 |
Last updated: 08.11.2013
Statistic S-2.1.2: Centralization of the Heat Supply (for Space Heating)
Percentages related to number of buildings per size
| Size of Building | SFH Single Family Houses No. of Buildings (%) |
TH Terrace Houses No. of Buildings (%) |
MFH Multi Family Houses No. of Buildings (%) |
| Central heating system | 71490 (40,16 %) | 2308 (12,8 %) | 15176 (21.1 %) |
| Room heating system | 102619 (57.65 %) | 15221 (84.5 %) | 53195 (73.8 %) |
| No heating system | 3902 (2.19 %) | 475 (2.7 %) | 3701 (5.1 %) |
Last updated: 08.11.2013
Statistic S-2.3.3 Type of Heat Generator
| Size of Building | SFH Single Family Houses No. of Buildings (%) |
TH Terrace Houses No. of Buildings (%) |
MFH Multi Family Houses No. of Buildings (%) |
| Central heating oil | 60201 (33.8 %) | 1,823 (10,1 %) | 11,186 (15.5 %) |
| Central heating gas | 4770 (2.7 %) | 188 (1 %) | 416 (0.6 %) |
| Central heaters electric) | 6519 (3.7 %) | 297 (1.6 %) | 3,574 (5 %) |
| Accumulators (EAC) | 3588 (2 %) | 190 (1,1 %) | 3,874 (5.38 %) |
| Solar heating system | 450 (0.3 %) | 39 (0.2 %) | 129 (0.2 %) |
| Air-conditioning with hot air | 40304 (22.6 %) | 5,826 (32.4 %) | 31,873 (44.2 %) |
| Fireplace | 13841 (7.8 %) | 1,206 (6.7 %) | 747 (1 %) |
| Electric heaters | 16087 (9 %) | 2,890 (16.1 %) | 8,468 (11.7 %) |
| Gas heaters (gas) | 24520 (13.8 %) | 4,460 (24.8 %) | 6,809 (9.4 %) |
| Oil heaters | 3742 (2 %) | 608 (3.4 %) | 1,291 (1.8 %) |
| Other kind of heating | 87 (0.05 %) | 2 (0.001 %) | 4 (0.005 %) |
| No heating system | 3902 (2.2 %) | 475 (2.6 %) | 3701 (5.1 %) |
Last updated: 08.11.2013
Statistic S-2.5: Heat Generation (DHW)
Percentages (number of buildings) related to solar systems for the whole national stock
| DHW System | (%) |
| Solar collectors (only) | 81.7 |
| Autonomous electric heater with cylinder combined with solar collectors | 2.9 |
| Autonomous electric heater with cylinder (only) | 0.7 |
| Autonomous heating gas with cylinder | 1,0 |
| Electric heaters combined with solar collectors | 4.2 |
| Electric heaters (only) | 2.5 |
| Gas heaters combined with solar collectors | 2.8 |
| Gas heaters (only) | 2.1 |
| Other | 2,1 |
Last updated: 08.11.2013
Statistic S-2.6: Solar Thermal Systems
Percentages related to dwellings in per size of buildings
| Solar thermal systems | SFH Single Family Houses No. of Buildings (%) |
TH Terrace Houses No. of Buildings (%) |
MFH Multi Family Houses No. of Buildings (%) |
| For heating water only | 164482 (92.4 %) | 16281 (90.4 %) | 65429 (90.1 %) |
| For heating the house and water | 1395 (0.8 %) | 56 (0.3 %) | 330 (0.5 %) |
| To produce electricity (photovoltaic) | 548 (0.3 %) | 7 (0.04 %) | 25 (0.03 %) |
| No solar thermal systems | 9642 (5.4 %) | 1417 (7.9 %) | 4546 (6.3 %) |
Last updated: 08.11.2013
Statistic S-2.8: Air Conditioning Systems
Percentage related to dwellings in the whole national stock
| Air conditioning systems | National Building Stock (%) |
| Split units | 82 % |
| No local cooling systems | 18 % |
Last updated: 08.11.2013
Statistic S-3.1: Domestic energy consumption
End use household energy consumption, 2009
Annual energy consumption / category
| Energy product | Unit | Space heating | Hot water | Space cooling | Cooking | Appliances - lightning | Total |
| Electricity | KWh | 642 | 382 | 1.107 | 554 | 3.603 | 6.288 |
| Heating Oil | litres | 331 | 24 | - | - | - | 355 |
| Pure Oil | litres | 42 | 2 | - | - | - | 44 |
| Natural Gas | kg | 50 | 8 | - | 67 | - | 125 |
| Biomass | kg | 231 | 2 | - | 11 | - | 244 |
| Coal | kg | - | - | - | 48 | - | 48 |
| Electricity | kgoe | 55 | 33 | 95 | 48 | 310 | 541 |
| Heating Oil | kgoe | 284 | 20 | - | - | - | 304 |
| Pure Oil | kgoe | 35 | 2 | - | - | - | 37 |
| Natural Gas | kgoe | 55 | 9 | - | 74 | - | 138 |
| Biomass | kgoe | 83 | 1 | - | 4 | - | 88 |
| Coal | kgoe | - | - | - | 34 | - | 34 |
| total | kgoe | 512 | 65 | 95 | 160 | 310 | 1.142 |
Annual energy consumption / household area
| Household Area (m2) | Annual Energy Consumption (kgoe) | |
| < 51 | 406 | |
| 51 - 100 | 639 | |
| 101 - 150 | 998 | |
| 151 - 200 | 1.470 | |
| 201 - 250 | 1.731 | |
| 251 - 300 | 1.946 | |
| 301 - 350 | 2.157 | |
| > 350 | 2.745 | |
Annual energy consumption by category gross household income
| Gross Annual Household Income (€ 000’) |
Annual Energy Consumption (kgoe) | |
| <= 10 | 587 | |
| 10 - 20 | 895 | |
| 20 - 30 | 1.147 | |
| 30 - 40 | 1.435 | |
| 40 - 55 | 1.624 | |
| 55 - 70 | 1.845 | |
| 70 - 100 | 1.870 | |
| >100 | 2.895 | |
Last Update 05/10/2011
COPYRIGHT © :2011, REPUBLIC OF CYPRUS, STATISTICAL SERVICE
Last updated: 04.09.2014
End use household energy consumption, 2009
Energy use for space heating
| HOUSEHOLD AREA, HEATED DURING THE ANNUAL COLD PERIOD | (%) |
| < 51 m2 | 41,0 |
| 51 - 100 m2 | 25,9 |
| 101 - 150 m2 | 15,6 |
| 151 - 200 m2 | 10,1 |
| 201 - 250 m2 | 4,0 |
| 251 - 300 m2 | 2,4 |
| 301 - 350 m2 | 0,7 |
| > 350 m2 | 0,3 |
| PRIMARY SYSTEM TYPE FOR HEATING | (%) |
| Central Heating | 29,2 |
| Solar Central Heating | 0,1 |
| Heat pumps | 0,0 |
| Split units for heating | 16,9 |
| Heaters ΑΗΚ | 4,8 |
| Fire Place | 7,3 |
| Heater (movable) | 39,3 |
| Stove (nonmovable metal) | 0,6 |
| Other | 0,2 |
| No heating system used | 1,6 |
| HEATING EQUIPMENT DURING THE REFERENCE YEAR / HEATING SYSTEM | (%) |
| < 1 month | 0,3 |
| 1 month | 1,4 |
| 2months | 11,0 |
| 3months | 26,2 |
| 4months | 41,8 |
| 5months | 14,9 |
| 6months | 4,1 |
| > 6months | 0,3 |
| DAILY HOURS OF OPERATION MAIN SYSTEM / HEATING EQUIPMENT DURING USE | (%) |
| <= 2 hrs | 9,6 |
| 3 - 5 hrs | 46,2 |
| 6 - 8 hrs | 29,7 |
| 9 - 11 hrs | 10,1 |
| 12 - 14 hrs | 2,5 |
| 15 - 17 hrs | 0,6 |
| > 17 hrs | 1,3 |
| SOURCE USED FOR THE OPERATION OF THE MAIN SYSTEM / HEATING EQUIPMENT | (%) |
| Electricity | 37,8 |
| Heating Oil | 27,0 |
| Pure Oil | 5,2 |
| Natural Gas | 22,1 |
| Biomass | 7,9 |
| ANNUAL ENERGY CONSTUMPTION / HOUSEHOLD | |
| Electricity | 642 KWh |
| Heating Oil | 331 litres |
| Pure Oil | 42 litres |
| Natural Gas | 50 kg |
| Biomass | 231 kg |
|
ANNUAL ENERGY CONSUMPTION FOR SPACE HEATING PER HOUSEHOLD |
(kgoe) |
| Electricity | 55 |
| Heating Oil | 284 |
| Pure Oil | 35 |
| Natural Gas | 55 |
| Biomass | 83 |
| Total | 512 |
Latest Update 05/10/2011
COPYRIGHT © :2011, REPUBLIC OF CYPRUS, STATISTICAL SERVICE
Last updated: 04.09.2014
End use household energy consumption, 2009
Energy demand for hot water
| AVAILABILITY HEATING SYSTEMS FOR HOT WATER AS PERCENT OF TOTAL HOUSEHOLDS | (%) |
| System connected with theCentral Heating | 29,3 |
| Solar thermal collectors | 91,6 |
| Autonomous Electric water heating with storage tank | 3,6 |
| Autonomous Natural Gas water heating with storage tank | 1,0 |
| Electric Thermitron | 6,7 |
| Natural Gas Thermitron | 4,9 |
| Other | 2,1 |
| PERCENTAGE OF HOUSEHOLDS THAT HAVE DHW STORAGE TANKS | 95,9% |
| CAPACITY OF DHW STORAGE TANK | (%) |
| < 100 litres | 2,7 |
| 100 - 149 litres | 4,8 |
| 150 - 199 litres | 79,4 |
| 200 - 249 litres | 10,8 |
| 250 - 299 litres | 1,3 |
| >= 300 litres | 1,0 |
| ANNUAL ENERGY CONSUMPTION FOR DHW / HOUSEHOLD | |
| Electricity | 382 KWh |
| Heating Oil | 24 litres |
| Pure Oil | 2 litres |
| Natural Gas | 8 kg |
| Biomass | 2 kg |
| ANNUAL ENERGY CONSUMPTION FOR DHW / HOUSEHOLD (in kilograms of oil equivalent) |
(kgoe) |
| Electricity | 33 |
| Heating Oil | 20 |
| Pure Oil | 2 |
| Natural Gas | 9 |
| Biomass | 1 |
| Total | 65 |
Latest Update 05/10/2011
COPYRIGHT © :2011, REPUBLIC OF CYPRUS, STATISTICAL SERVICE
Last updated: 04.09.2014
End use household energy consumption, 2009
Energy use for space cooling
| PERCENTAGE OF HOUSEHOLDS WITH A/C UNITS FOR SPACE COOLING | 80,8% |
| HOUSEHOLD AREA FOR COOLING PER HOT PERIOD DURING THE YEAR | (%) |
| < 51 m2 | 64,1 |
| 51 - 100 m2 | 24,2 |
| 101 - 150 m2 | 7,8 |
| 151 - 200 m2 | 2,6 |
| 201 - 250 m2 | 0,8 |
| 251 - 300 m2 | 0,3 |
| 301 - 350 m2 | 0,1 |
| > 350 m2 | 0,1 |
| MONTH AIR CONDITIONING UNITS DURING THE REFERENCE YEAR | (%) |
| < 1 month | 2,1 |
| 1 month | 4,5 |
| 2months | 27,7 |
| 3months | 25,4 |
| 4months | 34,1 |
| 5months | 5,0 |
| 6months | 1,2 |
| > 6months | 0,0 |
| HOURLY USAGE OF A/C UNITS DURING THE HOT PERIOD FOR COOLING | (%) |
| <= 2 hrs | 17,7 |
| 3 - 5 hrs | 41,1 |
| 6 - 8 hrs | 26,8 |
| 9 - 11 hrs | 9,9 |
| 12 - 14 hrs | 3,6 |
| 15 - 17 hrs | 0,6 |
| > 17 hrs | 0,3 |
| Annual electricity consumption for air-conditioning area per household | 1.107 ΚWh |
| Annual electricity consumption for air-conditioning space per household (in kilograms of oil equivalent) |
95 kgoe |
Latest Update 05/10/2011
COPYRIGHT © :2011, REPUBLIC OF CYPRUS, STATISTICAL SERVICE
Last updated: 04.09.2014
End use household energy consumption, 2009
Energy use for cooking
| COOKING APPLIANCES AVAILABLITY PERCENTAGE PER TOTAL HOUSEHOLD | (%) |
| Electric Cooker | 33,7 |
| Natural Gas Cooker | 72,9 |
| Electric Oven | 77,9 |
| Natrual Gas Oven | 25,6 |
| Microwave | 65,7 |
| Kitchen Hood | 70,0 |
| Toster | 83,0 |
| Coffe Machine | 32,8 |
| Electric kettle | 75,9 |
| External cooker | 63,4 |
| Other | 24,4 |
| MEAN TIME WEEKLY USE OF COOKING EQUIPMENT | (hrs) |
| Electric Cooker | 6,4 |
| Natural Gas Cooker | 9,9 |
| Electric Oven | 3,8 |
| Natrual Gas Oven | 3,3 |
| Microwave | 0,6 |
| Kitchen Hood | 5,4 |
| Toster | 0,6 |
| Coffe Machine | 0,6 |
| Electric kettle | 0,7 |
| Other | 1,6 |
| HOUSEHOLD PERCENTAGE THAT USE THESE ENERGY TYPES FOR COOKING | (%) |
| Electricity | 94,5 |
| Natural Gas | 73,8 |
| Wood | 4,7 |
| Coal | 58,0 |
| Other | 0,0 |
| ANNUAL ENERGY CONSUMPTION FOR COOKING PER HOUSEHOLD | |
| Electricity | 554 KWh |
| Natural Gas | 67 kg |
| Wood | 11 kg |
| Coal | 48 kg |
| ANNUAL ENERGY CONSUMPTION FOR COOKING per household (kg oil equivalent) | (kgoe) |
| Electricity | 48 |
| Natural Gas | 74 |
| Wood | 4 |
| Coal | 34 |
| Total | 160 |
Energy use for electrical appliances and lightning
| AVAILABILITY OF VARIOUS ELECTRONIC DEVICES AS A PERCENT OF TOTAL HOUSEHOLDS | (%) |
| Fridge- Freezer | 99,0 |
| Fridge | 4,3 |
| Freezer | 27,6 |
| Water cooler | 52,9 |
| Dishwasher | 44,6 |
| Washing Machine | 93,7 |
| Dryer (seperate) | 30,5 |
| Washer- Dryer | 2,7 |
| Electric Iron | 96,2 |
| Vacuum Cleaner | 60,4 |
| TV | 99,1 |
| VCR or DVD Player | 64,1 |
| Stereo | 45,7 |
| Satelitte Dish | 29,9 |
| PC | 60,0 |
| Printer | 40,8 |
| Modem | 51,2 |
| Fan | 68,9 |
| Incandescent (normal) | 90,5 |
| Compact fluorescent lamps | 87,9 |
| Other | 26,3 |
| MEAN TIME WEEKLY USE OF ELECTRONIC DEVICES | (hrs) |
| Dishwasher | 3,9 |
| Washing Machine | 7,2 |
| Dryer (seperate) | 3,5 |
| Washer- Dryer | 5,3 |
| Electric Iron | 2,5 |
| Vacuum Cleaner | 1,2 |
| TV | 45,9 |
| VCR or DVD Player | 2,5 |
| Stereo | 4,6 |
| PC | 31,1 |
| Printer | 0,7 |
| Fan | 15,2 |
| ANNUAL POWER CONSUMPTION FOR ELECTRICAL APPLIANCES & LIGHTING PER HOUSEHOLD | 3.603 KWh |
| ANNUAL POWER CONSUMPTION FOR ELECTRICAL APPLIANCES & LIGHTING PER HOUSEHOLD | 310 kgoe |
House hold properties
| NATIONAL HOUSEHOLD TYPOLOGY | (%) |
| Sinlge Family House | 50,0 |
| Dublex dwelling | 20,1 |
| Dublex dwelling | 21,7 |
| Terrace House | 6,7 |
| Other (i.e. utility house) | 1,5 |
| HOUSE PROPERTY ONWERSHIP TYPE | (%) |
| Private | 78,0 |
| Rental | 10,2 |
| Given for free | 11,8 |
| HOUSEHOLD AREA | (%) |
| < 51 m2 | 3,7 |
| 51 - 100 m2 | 24,8 |
| 101 - 150 m2 | 34,7 |
| 151 - 200 m2 | 18,8 |
| 201 - 250 m2 | 9,5 |
| 251 - 300 m2 | 4,7 |
| 301 - 350 m2 | 2,0 |
| > 350 m2 | 1,8 |
| YEAR OF CONSTRUCTION OF THE DWELLING | (%) |
| After 1971 | 17,9 |
| 1971 - 1980 | 18,8 |
| 1981 - 1990 | 23,9 |
| 1991 - 2000 | 20,2 |
| 2001 - 2003 | 6,0 |
| 2004 - 2006 | 9,2 |
| 2007 and later | 4,0 |
| PERCENTAGE OF TOTAL NUMBER OF HOUSEHOLDS WITH THERMAL INSULATION | (%) |
| External wall thermal insulation | 7,5 |
| Roof thermal insulation | 5,5 |
| Floor Slab thermal insulation | 0,8 |
| Installation of double glazed windows | 43,2 |
| Other type of thermal insulation | 0,4 |
| not thermally insulated | 54,4 |
Latest Update 05/10/2011
COPYRIGHT ©: 2011, REPUBLIC OF CYPRUS, STATISTICAL SERVICE
Last updated: 04.09.2014
| Responsible for the content of this page: CUT - Cyprus University of Technology (contact information) |
