- >
- Building Typology>
- COUNTRY PAGES>
- BG Bulgaria
BG Bulgaria - Country Page
National Contact Point
Information in Bulgarian language: National Contact Point Bulgaria
Residential Building Typology
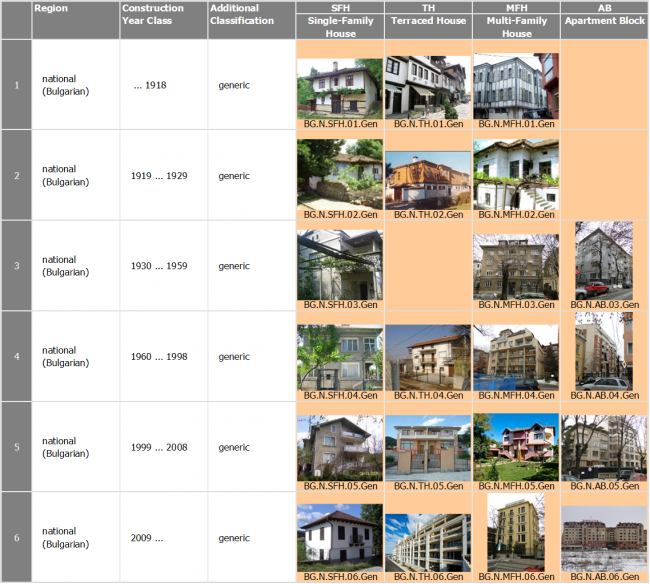
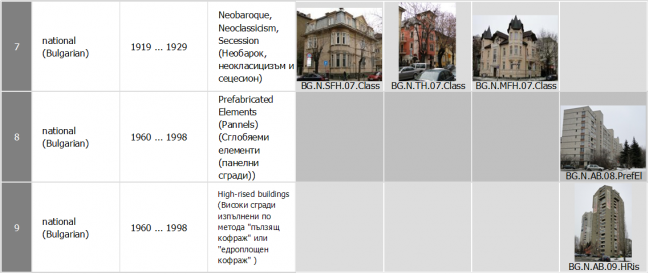
Building Type Matrix
classification scheme for residential buildings --- construction year classes --- pictures of example buildings
(►explanations)
Generic Building Types

Last updated: 18.06.2012
Further Building Types

Last updated: 18.06.2012
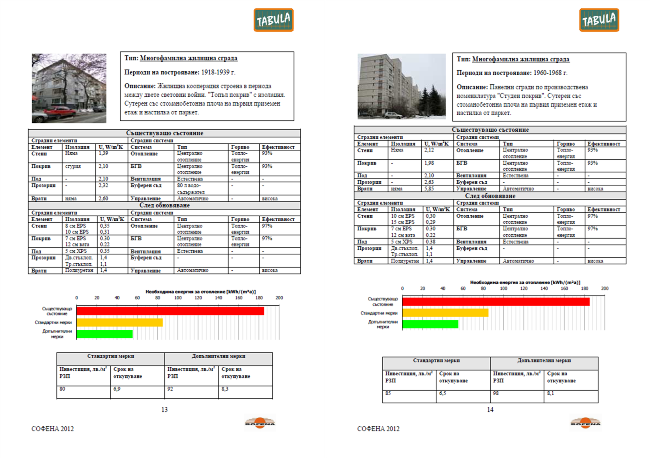
National Typology Brochure
example buildings --- typical energy consumption values --- effect of refurbishment measures --- building display sheets
(►explanations)
Brochure in Bulgarian language. (Click on picture to download PDF.)
Last updated: 21.01.2013
Statistics of the Bulgarian Building Stock
systematical overview --- available statistics for residential buildings and heat supply systems
(►explanations)
Overview
| Statistical Table | Item | Available | Sources |
| S-1.1 | Frequency of building types of the national building stock | yes | [1] |
| S-1.2.1 | Percentage of thermally refurbished envelope areas | yes | [1] |
| S-1.2.2 | Information on insulation level and window types | yes | [1], [2], [3] |
| S-2.1 | Centralisation of the heat supply (for space heating) | yes | [1], [2] |
| S-2.2 | Heat distribution and storage of space heating systems | ||
| S-2.3 | Heat generation of space heating systems | ||
| S-2.4 | Heat distribution and storage of domestic hot water systems | ||
| S-2.5 | Heat generation of domestic hot water systems | ||
| S-2.6 | Solar thermal systems | ||
| S-2.7 | Ventilation systems | ||
| S-2.8 | Air-conditioning systems | ||
| S-2.9 | Control of central heating systems |
[1] Source: National Statistical Institute, Census 2011
[2] Estimates done by SOFENA for TABULA project
[3] SOFENA estimate based on the refurbishment practices and normative requirements
Statistic S-1.1: Frequency of Building Types of the National Building Stock
Remarks:
(1) Buildings of mixed types with more than 60% residential area are not included
(2) Estimates done by SOFENA for TABULA project (only occupied dwellings are accounted and the living floor space)
Source of data: National Statistical Institute, Census 2011
Statistic S-1.2.1: Percentage of Thermally Refurbished Envelope Areas
| Building period | Total number of buildings | Heated area [m²] (2) | |
| Single family houses and terrace houses (1000) |
Apartment blocks and multifamily houses(1) (1000) |
All type of buildings (1000 m²) |
|
| until 1949 | 433,859 | 4,194 | 3209,74 |
| 1950-1959 | 347,473 | 4,679 | 3065,49 |
| 1960-1969 | 381,145 | 12,234 | 3424,37 |
| 1970-1979 | 240,816 | 14,162 | 2219,59 |
| 1980-1989 | 198,857 | 13,125 | 1845,31 |
| 1990-1999 | 96,922 | 7,913 | 912,591 |
| 2000-2011 | 74,144 | 13,023 | 758,791 |
| Total | 1773,216 | 69,397 | 15435,886 |
Remarks:
(1) Buildings of mixed types with more than 60% residential area are not included
(2) Estimates done by SOFENA for TABULA project (only occupied dwellings are accounted and the living floor space)
Source of data: National Statistical Institute, Census 2011
Statistic S-1.2.1: Percentage of Thermally Refurbished Envelope Areas
|
Dwellings |
Occupied dwellings |
Dwellings with external |
Dwellings with energy |
|
Total (number) |
2666733 |
428473 |
937574 |
|
Refurbished dwellings (%) |
16,1 |
35.2 |
Source of data: National Statistical Institute, Census 2011
Statistic S-1.2.2.: Average Insulation Thickness (eq. to EPS) added to the refurbished elements and U-values
| 1999 | 2009 | |
| Walls – insulation thickness | 50 mm | 80 mm |
| Walls U-values, (W/m².K) | 0,5 | 0,35 |
| Windows U-values (W/m².K) | 1,8-2,6 | 1,1-2,0 |
| Roofs / upper floor ceilings- – insulation thickness | 100 mm | 100 mm |
| Roofs / upper floor ceilings, U-values (W/m².K) | 0,3 | 0,3 |
| basement / cellar ceiling - insulation thickness | 50 mm | 50 mm |
| basement / cellar ceiling, U-values (W/m².K) | 0,5 | 0,5 |
Source of data: SOFENA estimate based on the refurbishment practices and normative requirements
Statistic S-2.1: Main Heat Supply Source in the Households
(% of occupied dwellings)
| District Heating | Electricity | Gasoil | Gas | Coal | Wood | Other (heat pumps, pellets, oth.) | |
| 2011 | 16,4 | 28,6 | 0,2 | 0,6 | 19,8 | 34,1 | 0,3 |
Source of data: National Statistical Institute, Census 2011


