


- >
- Building Typology>
- COUNTRY PAGES>
- BE Belgium
BE Belgium - Country Page
National Contact Point
| Information in Dutch language: | National Contact Point Belgium |
Residential Building Typology
Building Type Matrix
classification scheme for residential buildings --- construction year classes --- pictures of example buildings
(►explanations)
Generic Building Types
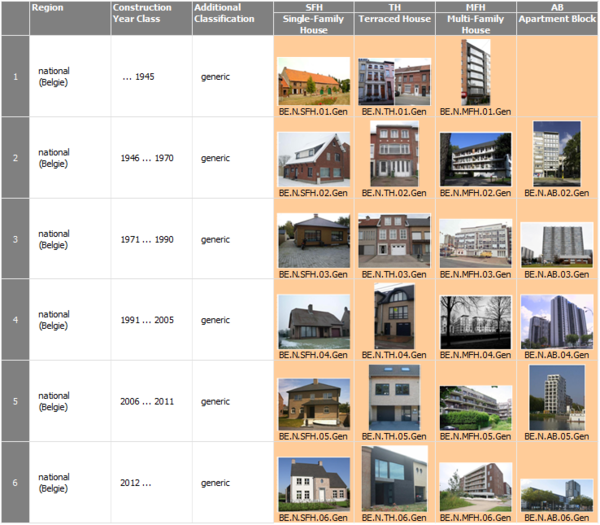
Last updated: 02.09.2014
Further Building Types
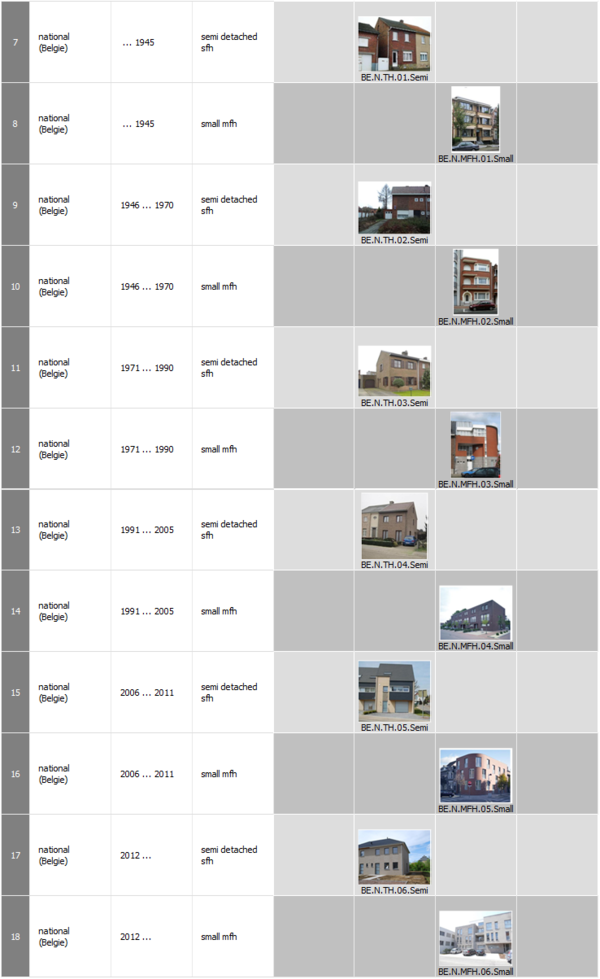
Last updated: 02.09.2014
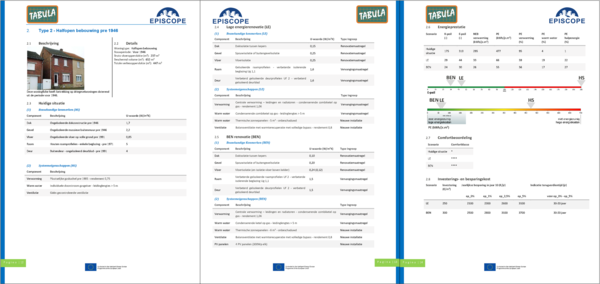
National Typology Brochure
example buildings --- typical energy consumption values --- effect of refurbishment measures --- building display sheets
(►explanations)
Brochure in Dutch language. (Click on picture to download PDF.)
Last updated: 02.09.2014
Statistics of the Belgian Building Stock
systematical overview --- available statistics for residential buildings and heat supply systems
(►explanations)
Overview
Overview according to the TABULA systematics for statistics
| Statistical Table | Item | Available | Sources |
| S-1.1 | Frequency of building types of the national building stock | yes | |
| S-1.2.1 | Percentage of thermally refurbished envelope areas | ||
| S-1.2.2 | Information on insulation level and window types | yes | |
| S-2.1 | Centralisation of the heat supply (for space heating) | yes | |
| S-2.2 | Heat distribution and storage of space heating systems | ||
| S-2.3 | Heat generation of space heating systems | yes | |
| S-2.4 | Heat distribution and storage of domestic hot water systems | ||
| S-2.5 | Heat generation of domestic hot water systems | ||
| S-2.6 | Solar thermal systems | ||
| S-2.7 | Ventilation systems | ||
| S-2.8 | Air-conditioning systems | ||
| S-2.9 | Control of central heating systems |
Statistic S-1.1: Frequency of Building Types of the National Building Stock
Frequencies of 6 aggregated, representative dwelling types in Belgian stock for the year 2006
| Building period | Number of housing units | ||
| Single Family Houses | SFH I | until 1970 | 2 126 913 |
| SFH II | 1970-1990 | 810 024 | |
| SFH III | 1991-2006 | 392 813 | |
| Multi Family Houses | MFH I | until 1970 | 656 743 |
| MFH II | 1970-1990 | 319 895 | |
| MFH III | 1991-2006 | 216 397 | |
| TOTAL | 4 522 784 | ||
Statistic S-1.2.2: Information on Insulation Level and Window Types
Average properties of building envelope for the 6 representative dwelling types (per housing unit, year 2006)
Average U-value
| Per housing unit | SFH I | SFH II | SFH III | MFH I | MFH II | MFH III | |
| U-value floor | W/m²K | 1,04 | 0,95 | 0,76 | 1,00 | 0,85 | 0,58 |
| U-value wall | W/m²K | 1,89 | 1,56 | 0,81 | 1,78 | 1,52 | 0,78 |
| U-value window | W/m²K | 3,91 | 3,53 | 2,53 | 3,99 | 3,67 | 2,47 |
| U-value roof | W/m²K | 1,86 | 1,32 | 0,69 | 1,92 | 1,36 | 0,57 |
Statistic S-2.1: Centralisation of the Heat supply (for Space Heating)
Overview of heating installations for 6 representative dwelling types per fuel type
(% of number of housing units per fuel type, year 2006)
| Energy Carrier | Heat generator | SFH I | SFH II | SFH III | MFH I | MFH II | MFH III | ||
| Natural Gas | Central | Individual | 26,0% | 14,8% | 12,7% | 7,2% | 4,4% | 7,9% | |
| Collective | 2,4% | 1,5% | 1,2% | ||||||
| Decentral | 15,3% | 1,8% | 0,5% | 3,3% | 0,6% | 0,4% | 100% | ||
| Fuel oil | Central | Individual | 43,0% | 23,6% | 9,8% | 2,5% | 0,9% | 0,5% | |
| Collective | 4,8% | 1,9% | 0,4% | ||||||
| Decentral | 10,2% | 1,4% | 0,4% | 0,4% | 0,1% | 0,1% | 100% | ||
| Wood | Central | 9,2% | 5,5% | 2,4% | 1,0% | 0,6% | 0,4% | ||
| Decentral | 54,0% | 17,9% | 6,8% | 1,6% | 0,4% | 0,3% | 100% | ||
| LPG | Central | 18,1% | 6,1% | 4,9% | 2,1% | 1,1% | 0,9% | ||
| Decentral | 52,9% | 7,6% | 2,4% | 2,8% | 0,7% | 0,3% | 100% | ||
| Coal | Central | 5,6% | 1,9% | 0,3% | 0,6% | 0,3% | 0,2% | ||
| Decentral | 77,2% | 9,7% | 1,6% | 2,2% | 0,4% | 0,1% | 100% | ||
| Electricity | Direct | 19,3% | 29,3% | 12,3% | 9,9% | 9,7% | 19,5% | ||
| Heat pump | 100% |
Statistic S-2.3: Heat Generation of Space Heating Systems
Energy Carriers
Overview of fuel types for 6 representative dwelling types (% of total number of housing units, year 2006)
| Energy carrier | TOTAL | SFH I | SFH II | SFH III | MFH I | MFH II | MFH III |
| Natural gas | 49% | 21% | 7% | 4% | 9% | 4% | 3% |
| Fuel oil | 39% | 21% | 8% | 3% | 4% | 2% | 0% |
| Coal | 2% | 2% | 0% | 0% | 0% | 0% | 0% |
| LPG | 1% | 1% | 0% | 0% | 0% | 0% | 0% |
| Electricity | 7% | 1% | 2% | 1% | 1% | 1% | 1% |
| Wood | 1% | 1% | 0% | 0% | 0% | 0% | 0% |
| Total | 100% | 47% | 18% | 9% | 15% | 7% | 5% |
National Scientific Report Belgium
Fundamentals and elements of the national residential building typology
Download:<BE_TABULA_ScientificReport_Vito.pdf>
(in English Language)
Last updated: 31.08.2011
| Responsible for the content of this page: VITO - Flemish Institute of Technological Research (contact information) |
