- >
- Building Typology>
- COUNTRY PAGES>
- AT Austria
AT Austria - Country Page
National Contact Point
| Information in German language: | National Contact Point Austria (EPISCOPE) |
| TABULA Building Typology Austria |
Residential Building Typology
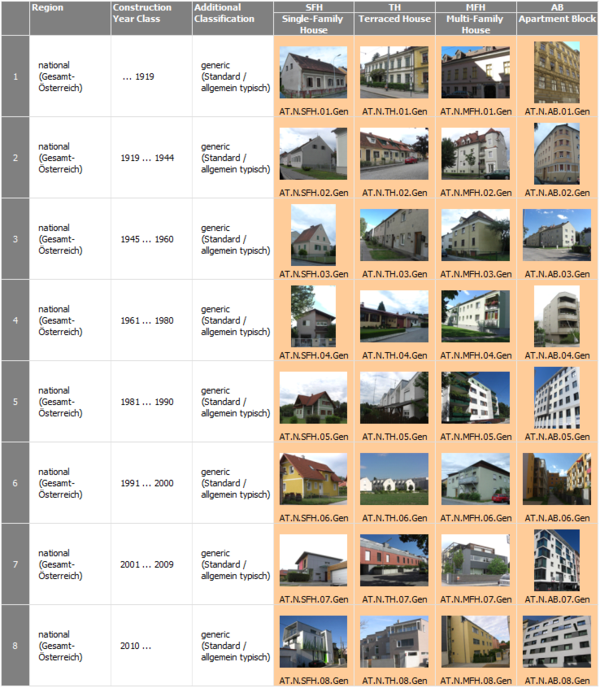
Building Type Matrix
classification scheme for residential buildings --- construction year classes --- pictures of example buildings
(►explanations)
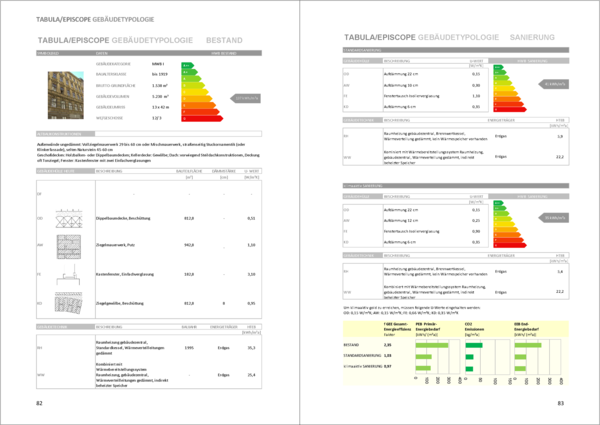
National Typology Brochure
example buildings --- typical energy consumption values --- effect of refurbishment measures --- building display sheets
(►explanations)
Brochure in German language. (Click on picture to download PDF.)
Statistics of the Austrian Building Stock
systematical overview --- available statistics for residential buildings and heat supply systems
(►explanations)
Overview
| Statistical Table | Item | Available | Sources |
| S-1.1 | Frequency of building types of the national building stock | yes | [1] |
| S-1.2.1 | Percentage of thermally refurbished envelope areas | yes | [2] |
| S-1.2.2 | Information on insulation level and window types | yes | [3] |
| S-2.1 | Centralisation of the heat supply (for space heating) | yes | [4] |
| S-2.2 | Heat distribution and storage of space heating systems | ||
| S-2.3 | Heat generation of space heating systems | yes | [4] |
| S-2.4 | Heat distribution and storage of domestic hot water systems | ||
| S-2.5 | Heat generation of domestic hot water systems | ||
| S-2.6 | Solar thermal systems | ||
| S-2.7 | Ventilation systems | ||
| S-2.8 | Air-conditioning systems | ||
| S-2.9 | Control of central heating systems |
[1] Statistik Austria 2014
[2] Environment Agency Austria 2013
[3] ZEUS database 2014; Construction of old buildings: Energieberatung Salzburg, May 2009; Default values OIB Guidelines 6: OIB RL6 2011; IBO, Passivhaus catalogue of building elements, June 2014
[4] combined tables; Statistik Austria, Gebäude- und Wohnungszählung 2001
Statistic S-1.1: Frequency of Building Types of the National Building Stock
Number of residential buildings and square metres useful floor area
|
|
Construction Period |
|
SFH |
TRH & MFH |
AB |
||
| from |
to |
|
single family houses |
terrassed and multi-family houses* |
apartment blocks |
||
|
1 |
|
1918 |
number of res.-bui. |
171,291 |
34,790 |
15,203 |
|
|
square metres |
24,775,075 |
14,003,842 |
16,947,540 |
||||
|
2 |
1919 |
1944 |
number of res.-bui. |
97,794 |
18,033 |
5,020 |
|
|
square metres |
11,920,467 |
6,069,886 |
4,326,033 |
||||
|
3 |
1945 |
1960 |
number of res.-bui. |
158,417 |
19,763 |
7,771 |
|
|
square metres |
20,047,041 |
7,049,862 |
7,367,726 |
||||
|
4 |
1961 |
1980 |
number of res.-bui. |
419,848 |
37,356 |
21,732 |
|
|
square metres |
59,755,244 |
14,943,948 |
28,868,193 |
||||
|
5 |
1981 |
1990 |
number of res.-bui. |
224,692 |
17,845 |
6,114 |
|
|
square metres |
32,463,527 |
7,879,064 |
8,410,398 |
||||
|
6 |
1991** |
2000** |
number of res.-bui. |
170,966 |
18,446 |
4,510 |
|
|
square metres |
24,491,315 |
8,159,392 |
5,185,161 |
||||
|
7 |
2001 |
2010 |
number of res.-bui. |
179,083 |
19,137 |
5,038 |
|
|
square metres |
27,605,363 |
8,384,987 |
6,178,288 |
||||
|
8 |
2011 |
2013 |
number of res.-bui. |
25,714 |
2,873 |
1,345 |
|
|
square metres |
4,262,240 |
1,343,948 |
1,707,848 |
||||
missing** |
number of res.-bui. |
36,371 |
3,354 |
2,144 |
|||
|
square metres |
4,335,113 |
1,563,331 |
3,346,185 |
||||
|
sub total |
number of
res.-bui. |
1,483,812 |
171,597 |
68,877 |
|||
|
square metres |
209,655,385 |
69,398,260 |
82,337,372 |
||||
| total |
number of res.-bui. |
1,724,286 |
|||||
|
square metres |
361,391,017 |
||||||
* In the statistical data the terraced houses are inlcude din the category multi-familiy houses.
** Due to a gap in the data collection the construction period 1991-2000 is slightly underrecorded. These cases are included in the construction period "missing".
Source: Statistik Austria 2014
Last updated: 15.03.2016
Statistic S-1.2.1: Percentage of Thermally Refurbished Envelope Areas
Renovations rates between 2000–2010 in Austria
| % of total stock of dwellings per year | Rehabilitation of windows in major parts of the building | Rehabilitation of facades including thermal insulation | Change of boilers | Insulation of the upper ceiling | Combination of three out of four renovation activities | |||
| Residential buildings | 2.4 % | 1.8 % | 1.8 % | 1.5 % | 0.9 % | |||
Source: Environment Agency Austria 2013
Last updated: 15.03.2016
Statistic S-1.2.2: Information on Insulation Level and Window Types
U-values and energy use for heating
|
I Until 1918 |
II 1919-44 |
III 1945-59 |
IV 1960-79 |
V 1980-89 |
VI 1990-99 |
VII 2000-20 |
VIII >2000 |
|
| U-values [W/(m²K)] | Characteristical average U-values | Indicatory U-value | Indicatory U-value | |||||
| Roof | 1.7 | 1.7 | 1.7 | 0.8 | 0.5 | 0.3 | 0.2 | 0.1 |
| Upper ceiling | 1.1 | 0.8 | 0.8 | 0.7 | 0.4 | 0.3 | 0.2 | 0.1 |
| Wall | 1.8 | 1.8 | 1.6 | 1.4 | 0.7 | 0.4 | 0.35 | 0.1 |
| Window | 2.2 | 2.3 | 2.3 | 2.7 | 2.5 | 1.8 | 1.4 | 0.6 |
| Floor | 1.2 | 1.2 | 1.2 | 0.8 | 0.5 | 0.5 | 0.4 | 0.2 |
| Space heating demand [kWh/(m²yr)] |
Characteristical average values | Indicatory value | Indicatory value | |||||
| 130-300 | 140-260 | 140-340 | 130-235 | 70-230 | 75-95 | 40-88 | 10-64 | |
Sources: ZEUS database 2014; Construction of old buildings: Energieberatung Salzburg, May 2009; Default values OIB Guidelines 6: OIB RL6 2011; IBO, Passivhaus catalogue of building elements, June 2014
Last updated: 15.03.2016
Statistic S-2.1: Centralisation of the heat supply (for space heating)
Statistic S-2.3: Heat generation of space heating systems (combined)
Number of buildings by building use and heating system
| Pre-dominant use of the building
|
Buildings total |
Central heating systems in buildings |
||||||||||
| Total | District heating |
Biomass district heating / zone heating and central heating system in buildings |
||||||||||
| Sub-total | Energy carrier | |||||||||||
| Oil | Wood | Wood chips and similar |
Coal and similar |
Electricity | Gas | Alter- native heating |
Others | |||||
| Total (including non residential build.) | 2,046,712 | 1,522,050 | 84,440 | 1,437,610 | 595,964 | 254,085 | 41,245 | 45,442 | 59,174 | 418,254 | 21,444 | 2,002 |
| Residential buildings with 1 or 2 flats | 1,557,420 | 1,237,030 | 30,725 | 1,206,305 | 486,979 | 240,391 | 31,917 | 43,580 | 44,969 | 338,200 | 19,209 | 1,060 |
| Residential buildings with 3 to 10 flats | 142,351 | 84,133 | 17,511 | 66,622 | 32,061 | 4,491 | 2,016 | 727 | 3,057 | 23,679 | 531 | 60 |
| Residential buildings with 11 ore more flats | 61,196 | 33,862 | 18,534 | 15,328 | 6,857 | 74 | 197 | 20 | 773 | 7,316 | 68 | 23 |
| Building period | District heating |
Central heating (N.Gas) |
Central heating (Oil) |
Electricity | Stoves etc. | Heat pump |
Other | Total |
| Før 1850 | 2,916 | 3,214 | 15,604 | 5,369 | 6,841 | 1,214 | 368 | 35,526 |
| 1851 - 1930 | 66,137 | 35,173 | 120,088 | 22,477 | 42,489 | 8022 | 2,269 | 296,655 |
| 1931 - 1950 | 51,703 | 25,320 | 39,992 | 5,248 | 8,735 | 2,198 | 493 | 133,689 |
| 1951 - 1960 | 47,607 | 26024 | 25,274 | 3,676 | 3,692 | 1,196 | 210 | 107679 |
| 1961 - 1972 | 131,414 | 78,902 | 46,066 | 9,546 | 4,246 | 2,987 | 354 | 273,515 |
| 1973 - 1978 | 68,449 | 37,778 | 20,362 | 17,356 | 1,998 | 1,664 | 187 | 147794 |
| 1979 - 1998 | 55,955 | 30,089 | 11,831 | 24,125 | 2,367 | 2,519 | 320 | 127206 |
| 1999 - 2006 | 23,053 | 16,416 | 4,305 | 1,327 | 1,811 | 1,726 | 252 | 48,890 |
| Efter 2007 | 14,982 | 8,869 | 1,803 | 363 | 996 | 3,965 | 220 | 31,198 |
| Total | 462,216 | 261,785 | 285,325 | 89,487 | 73,175 | 25,491 | 4,673 | 1,202,152 |
Statistic S-2.8: Air Conditioning Systems
|
Cooling/ air conditioning systems |
Single unit houses |
Multi unit houses |
||||
|
Until 1978 |
1979-2001 |
Since 2002 |
Until 1978 |
1979-2001 |
Since 2002 |
|
|
No cooling/ airconditioning system |
100 % |
100 % |
99.5 % |
100 % |
100 % |
100 % |
|
Cooling/ airconditioning system |
0 % |
0 % |
0.5 % |
0 % |
0 % |
0 % |
Last updated: 24.10.2013
National Scientific Report Austria
Fundamentals and elements of the national residential building typology
Download:<AT_TABULA_ScientificReport_AEA.pdf>
(in English Language)
Last updated: 12.12.2011


