


- >
- Building Typology>
- COUNTRY PAGES>
- SI Slovenia
SI Slovenia - Country Page
National Contact Point
| Information in Slovenian language: | National Contact Point Slovenia (EPISCOPE) |
| TABULA Building Typology Slovenia |
Residential Building Typology
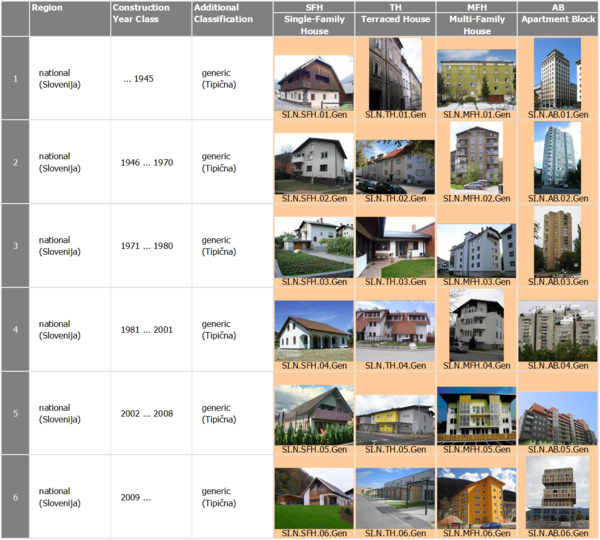
Building Type Matrix
classification scheme for residential buildings --- construction year classes --- pictures of example buildings
(►explanations)
Generic Building Types
Last updated: 02.09.2014
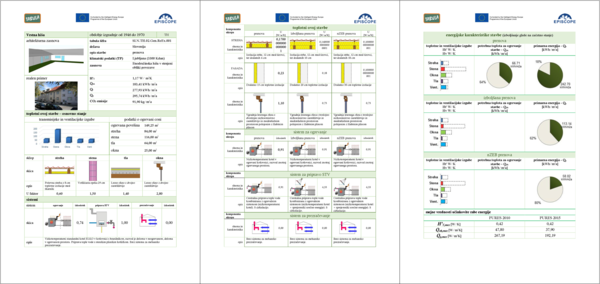
National Typology Brochure
example buildings --- typical energy consumption values --- effect of refurbishment measures --- building display sheets
(►explanations)
Brochure in Slovenian language. (Click on picture to download pdf.)
Last updated: 23.10.2014
Statistics of the Slovenian Building Stock
systematical overview --- available statistics for residential buildings and heat supply systems
(►explanations)
Overview
| Statistical Table | Item | Available | Sources |
| S-1.1 | Frequency of building types of the national building stock | yes | [1] |
| S-1.2.1 | Percentage of thermally refurbished envelope areas | yes | [2] |
| S-1.2.2 | Information on insulation level and window types | yes | [2] |
| S-2.1 | Centralisation of the heat supply (for space heating) | yes | [1] |
| S-2.2 | Heat distribution and storage of space heating systems | ||
| S-2.3 | Heat generation of space heating systems | yes | [2] |
| S-2.4* | Centralization of the heat supply (for domestic hot water) | yes | [2] |
| S-2.4 | Heat distribution and storage of domestic hot water systems | ||
| S-2.5 | Heat generation of domestic hot water systems | yes | [2] |
| S-2.6 | Solar thermal systems | ||
| S-2.7 | Ventilation systems | yes | [2] |
| S-2.8 | Air-conditioning systems | yes | [2] |
| S-2.9 | Control of central heating systems | yes | [2] |
| S-3.1 | Domestic energy consumption | yea | [3] |
Data sources
[1] Source: Registry of buildings, 2009, http://e-prostor.gov.si/?id=601
[2] Source: REUS survey, 2011
[3] Source: SURS-
Last updated: 02.09.2014
Statistic S-1.1: Frequency of building types of the national building stock
|
Building type |
number of |
number of |
living space |
TABULA reference |
|
SI.N.SFH.01.Gen |
140.605 |
150.283 |
13.474 |
14.822 |
|
SI.N.SFH.02.Gen |
91.163 |
99.013 |
8.996 |
9.895 |
|
SI.N.SFH.03.Gen |
82.684 |
88.604 |
8.919 |
9.811 |
|
SI.N.SFH.04.Gen |
114.561 |
118.970 |
12.043 |
13.247 |
|
SI.N.SFH.05.Gen |
21.567 |
22.093 |
2.571 |
2.828 |
|
SI.N.SFH.06.Gen |
99 |
102 |
9 |
10 |
|
SI.N.TH.01.Gen |
12.974 |
14.897 |
1.214 |
1.336 |
|
SI.N.TH.02.Gen |
11.383 |
12.800 |
1.108 |
1.218 |
|
SI.N.TH.03.Gen |
7.505 |
8.354 |
799 |
879 |
|
SI.N.TH.04.Gen |
8.301 |
9.078 |
939 |
1.032 |
|
SI.N.TH.05.Gen |
2.394 |
2.575 |
273 |
300 |
|
SI.N.TH.06.Gen |
47 |
56 |
4 |
5 |
|
SI.N.MFH.01.Gen |
10.693 |
60.531 |
3.647 |
4.011 |
|
SI.N.MFH.02.Gen |
5.142 |
39.591 |
2.031 |
2.235 |
|
SI.N.MFH.03.Gen |
2.105 |
16.238 |
866 |
953 |
|
SI.N.MFH.04.Gen |
2.248 |
18.320 |
1.010 |
1.111 |
|
SI.N.MFH.05.Gen |
1.152 |
9.233 |
562 |
618 |
|
SI.N.MFH.06.Gen |
14 |
84 |
5 |
6 |
|
SI.N.AB.01.Gen |
930 |
43.683 |
2.184 |
2.402 |
|
SI.N.AB.02.Gen |
885 |
35.085 |
1.482 |
1.630 |
|
SI.N.AB.03.Gen |
1.060 |
50.667 |
2.350 |
2.585 |
|
SI.N.AB.04.Gen |
826 |
38.962 |
1.899 |
2.089 |
|
SI.N.AB.05.Gen |
256 |
12.397 |
712 |
784 |
|
SI.N.AB.06.Gen |
4 |
1.077 |
66 |
72 |
|
Building Stock total |
518.598 |
852.693 |
67.164 |
73.881 |
|
Building type (condensed) |
number of |
number of |
living space |
TABULA reference |
|
|
SUH.01 |
153.579 |
165.180 |
14.689 |
16.157 |
Single Unit Houses |
|
SUH.02 |
102.546 |
111.813 |
10.103 |
11.114 |
|
|
SUH.03 |
90.189 |
96.958 |
9.718 |
10.690 |
|
|
SUH.04 |
122.862 |
128.048 |
12.981 |
14.280 |
|
|
SUH.05 |
23.961 |
24.668 |
2.844 |
3.129 |
|
|
SUH.06 |
146 |
158 |
14 |
15 |
|
|
MUH.01 |
11.623 |
104.214 |
5.830 |
6.413 |
Multi Unit Houses |
|
MUH.02 |
6.027 |
74.676 |
3.514 |
3.865 |
|
|
MUH.03 |
3.165 |
66.905 |
3.216 |
3.538 |
|
|
MUH.04 |
3.074 |
57.282 |
2.909 |
3.200 |
|
|
MUH.05 |
1.408 |
21.630 |
1.274 |
1.401 |
|
|
MUH.06 |
18 |
1.161 |
71 |
78 |
|
|
Building Stock total |
518.598 |
852.693 |
67.164 |
73.881 |
Statistic S-1.2.1: Percentage of thermally refurbished envelope areas
|
Building classes |
walls |
roofs |
upper floor ceilings |
basement/ |
windows |
|
Single Unit Houses |
|||||
|
SUH.01 |
38% |
74% |
38% |
no data |
84% |
|
SUH.02 |
45% |
74% |
48% |
no data |
74% |
|
SUH.03 |
38% |
58% |
49% |
no data |
46% |
|
SUH.04 |
35% |
34% |
31% |
no data |
31% |
|
SUH.05 |
20% |
7% |
9% |
no data |
0% |
|
SUH.06 |
0% |
0% |
0% |
no data |
0% |
|
Multi Unit Houses |
|||||
|
MUH.01 |
14% |
55% |
17% |
no data |
77% |
|
MUH.02 |
16% |
56% |
21% |
no data |
52% |
|
MUH.03 |
14% |
38% |
20% |
no data |
49% |
|
MUH.04 |
26% |
34% |
18% |
no data |
27% |
|
MUH.05 |
17% |
0% |
0% |
no data |
0% |
|
MUH.06 |
0% |
0% |
0% |
no data |
0% |
Statistic S-1.2.2: Information on insulation level and window types
|
Thickness of roof insulation layer (eg. mineral wall, polystyrene) |
||||||
|
Building classes |
no insulation |
less then 5 cm |
from 6 to 15 cm |
from 16 to 30 cm |
more then 30 cm |
no data |
|
Single Unit Houses |
||||||
|
SUH.01 |
50,80% |
13% |
17% |
11% |
1% |
8% |
|
SUH.02 |
44,60% |
9% |
29% |
11% |
1% |
6% |
|
SUH.03 |
27,50% |
13% |
39% |
14% |
2% |
6% |
|
SUH.04 |
34,50% |
9% |
31% |
16% |
3% |
7% |
|
SUH.05 |
11,40% |
6% |
25% |
29% |
10% |
18% |
|
SUH.06 |
45,70% |
17% |
37% |
|||
|
Multi Unit Houses |
||||||
|
MUH.01 |
74,00% |
7% |
4% |
15% |
||
|
MUH.02 |
42,40% |
4% |
11% |
5% |
5% |
34% |
|
MUH.03 |
42,00% |
8% |
16% |
2% |
33% |
|
|
MUH.04 |
8,30% |
22% |
26% |
9% |
1% |
34% |
|
MUH.05 |
16,80% |
17% |
27% |
14% |
25% |
|
|
MUH.06 |
100% |
|||||
|
Thickness of exterior wall insulation layer (eg. mineral wall, polystyrene) |
|||||
|
Building classes |
no insulation |
less then 5 cm |
from 6 to 10 cm |
more then 10 cm |
no data |
|
Single Unit Houses |
|||||
|
SUH.01 |
53% |
20% |
14% |
7% |
7% |
|
SUH.02 |
45% |
16% |
29% |
7% |
3% |
|
SUH.03 |
34% |
24% |
34% |
7% |
2% |
|
SUH.04 |
19% |
24% |
40% |
13% |
4% |
|
SUH.05 |
10% |
5% |
52% |
22% |
11% |
|
SUH.06 |
46% |
17% |
37% |
||
|
Multi Unit Houses |
|||||
|
MUH.01 |
73% |
10% |
3% |
8% |
7% |
|
MUH.02 |
51% |
17% |
6% |
26% |
|
|
MUH.03 |
48% |
15% |
16% |
21% |
|
|
MUH.04 |
12% |
28% |
28% |
5% |
27% |
|
MUH.05 |
34% |
52% |
14% |
||
|
MUH.06 |
100% |
||||
|
Windows type |
||||||||
|
Building classes |
Casement single glassing window |
box window (2 Casement single window, between gap more then 10 cm) |
box window (2 Casement single window, between gap less then 10 cm) |
Casement double glassing window |
Casement double low E glassing window |
Casement triple low E glassing window |
other |
no data |
|
Single Unit Houses |
||||||||
|
SUH.01 |
13% |
29% |
18% |
34% |
1% |
2% |
1% |
3% |
|
SUH.02 |
8% |
26% |
14% |
37% |
10% |
3% |
2% |
|
|
SUH.03 |
5% |
24% |
19% |
35% |
12% |
4% |
1% |
|
|
SUH.04 |
5% |
16% |
19% |
44% |
11% |
4% |
1% |
1% |
|
SUH.05 |
2% |
12% |
23% |
37% |
15% |
11% |
||
|
SUH.06 |
37% |
46% |
17% |
|||||
|
Multi Unit Houses |
||||||||
|
MUH.01 |
5% |
33% |
31% |
21% |
3% |
7% |
||
|
MUH.02 |
5% |
40% |
18% |
30% |
4% |
2% |
1% |
|
|
MUH.03 |
12% |
11% |
6% |
63% |
7% |
1% |
||
|
MUH.04 |
15% |
18% |
12% |
48% |
8% |
|||
|
MUH.05 |
17% |
50% |
17% |
17% |
||||
|
MUH.06 |
100% |
|||||||
Statistic S-2.1: Centralisation of the heat supply (for space heating)
|
percentage of buildings per building class
|
Single Unit Houses
|
Multi Unit Houses
|
||||||||||
|
SUH.01
|
SUH.02
|
SUH.03
|
SUH.04
|
SUH.05
|
SUH.06
|
MUH.01
|
MUH.02
|
MUH.03
|
MUH.04
|
MUH.05
|
MUH.06
|
|
|
local heating, room heating
|
26%
|
9%
|
5%
|
5%
|
6%
|
0%
|
25%
|
10%
|
3%
|
7%
|
16%
|
0%
|
|
floor heating
|
12%
|
12%
|
6%
|
7%
|
3%
|
0%
|
27%
|
15%
|
14%
|
20%
|
33%
|
100%
|
|
central heating for building
|
61%
|
78%
|
87%
|
87%
|
91%
|
100%
|
33%
|
37%
|
37%
|
47%
|
42%
|
0%
|
|
district heating
|
0%
|
1%
|
3%
|
1%
|
1%
|
0%
|
14%
|
38%
|
46%
|
26%
|
9%
|
0%
|
|
total
|
100%
|
100%
|
100%
|
100%
|
100%
|
100%
|
100%
|
100%
|
100%
|
100%
|
100%
|
100%
|
|
percentage of buildings per building class
|
Single Unit Houses
|
Multi Unit Houses
|
||||||||||
|
SUH.01
|
SUH.02
|
SUH.03
|
SUH.04
|
SUH.05
|
SUH.06
|
MUH.01
|
MUH.02
|
MUH.03
|
MUH.04
|
MUH.05
|
MUH.06
|
|
|
other heating
|
28%
|
15%
|
10%
|
8%
|
7%
|
11%
|
28%
|
27%
|
12%
|
8%
|
7%
|
6%
|
|
central heating
|
55%
|
78%
|
85%
|
85%
|
77%
|
84%
|
57%
|
53%
|
62%
|
67%
|
78%
|
72%
|
|
district heating
|
1%
|
2%
|
1%
|
1%
|
1%
|
3%
|
10%
|
16%
|
25%
|
23%
|
12%
|
17%
|
|
no heating
|
16%
|
5%
|
4%
|
6%
|
15%
|
1%
|
5%
|
3%
|
2%
|
2%
|
2%
|
6%
|
|
no data
|
0%
|
0%
|
0%
|
0%
|
0%
|
0%
|
1%
|
0%
|
0%
|
0%
|
0%
|
0%
|
|
total
|
100%
|
100%
|
100%
|
100%
|
100%
|
100%
|
100%
|
100%
|
100%
|
100%
|
100%
|
100%
|
|
Building type
|
no
heating |
central
heating |
other
heating |
district
heating |
no
data |
Total
|
|
|
Single Unit Houses
|
SI.N.SFH.01.Gen
|
22.042
|
77.672
|
39.535
|
832
|
524
|
140.605
|
|
SI.N.SFH.02.Gen
|
5.177
|
70.148
|
14.620
|
1.218
|
0
|
91.163
|
|
|
SI.N.SFH.03.Gen
|
3.317
|
70.456
|
8.080
|
831
|
0
|
82.684
|
|
|
SI.N.SFH.04.Gen
|
6.940
|
97.031
|
9.905
|
682
|
3
|
114.561
|
|
|
SI.N.SFH.05.Gen
|
3.328
|
16.464
|
1.599
|
158
|
18
|
21.567
|
|
|
SI.N.SFH.06.Gen
|
2
|
76
|
16
|
5
|
0
|
99
|
|
|
SI.N.TH.01.Gen
|
2.051
|
6.985
|
3.667
|
132
|
139
|
12.974
|
|
|
SI.N.TH.02.Gen
|
213
|
9.517
|
1.272
|
381
|
0
|
11.383
|
|
|
SI.N.TH.03.Gen
|
137
|
6.543
|
508
|
316
|
1
|
7.505
|
|
|
SI.N.TH.04.Gen
|
254
|
7.302
|
442
|
302
|
1
|
8.301
|
|
|
SI.N.TH.05.Gen
|
188
|
2.047
|
88
|
57
|
14
|
2.394
|
|
|
SI.N.TH.06.Gen
|
0
|
47
|
0
|
0
|
0
|
47
|
|
|
Multi Unit Houses
|
SI.N.MFH.01.Gen
|
528
|
6.195
|
3.121
|
755
|
94
|
10.693
|
|
SI.N.MFH.02.Gen
|
164
|
2.802
|
1.531
|
645
|
0
|
5.142
|
|
|
SI.N.MFH.03.Gen
|
68
|
1.429
|
336
|
272
|
0
|
2.105
|
|
|
SI.N.MFH.04.Gen
|
58
|
1.626
|
218
|
345
|
1
|
2.248
|
|
|
SI.N.MFH.05.Gen
|
35
|
922
|
86
|
108
|
1
|
1.152
|
|
|
SI.N.MFH.06.Gen
|
1
|
12
|
1
|
0
|
0
|
14
|
|
|
SI.N.AB.01.Gen
|
28
|
395
|
82
|
401
|
24
|
930
|
|
|
SI.N.AB.02.Gen
|
16
|
407
|
114
|
348
|
0
|
885
|
|
|
SI.N.AB.03.Gen
|
4
|
521
|
31
|
504
|
0
|
1.060
|
|
|
SI.N.AB.04.Gen
|
4
|
423
|
34
|
365
|
0
|
826
|
|
|
SI.N.AB.05.Gen
|
0
|
183
|
10
|
61
|
2
|
256
|
|
|
SI.N.AB.06.Gen
|
0
|
1
|
0
|
3
|
0
|
4
|
|
|
Building Stock total
|
44.555
|
379.204
|
85.296
|
8.721
|
822
|
518.598
|
Statistic S-2.3: Heat generation of space heating systems
|
percentage of buildings per building class
|
Single Unit Houses
|
Multi Unit Houses
|
||||||||||
|
SUH.01
|
SUH.02
|
SUH.03
|
SUH.04
|
SUH.05
|
SUH.06
|
MUH.01
|
MUH.02
|
MUH.03
|
MUH.04
|
MUH.05
|
MUH.06
|
|
|
old wood or coal boiler
|
45%
|
30%
|
35%
|
25%
|
20%
|
50%
|
26%
|
9%
|
2%
|
14%
|
0%
|
0%
|
|
old oil or gas boiler
|
32%
|
42%
|
42%
|
49%
|
37%
|
17%
|
53%
|
58%
|
84%
|
69%
|
86%
|
100%
|
|
low energy boiler
|
1%
|
0%
|
2%
|
2%
|
3%
|
0%
|
0%
|
3%
|
2%
|
0%
|
0%
|
0%
|
|
condensation boiler
|
0%
|
0%
|
1%
|
0%
|
6%
|
0%
|
0%
|
0%
|
0%
|
1%
|
0%
|
0%
|
|
new biomass boiler
|
4%
|
2%
|
4%
|
5%
|
11%
|
0%
|
7%
|
1%
|
2%
|
0%
|
0%
|
0%
|
|
electric heater
|
0%
|
2%
|
0%
|
0%
|
3%
|
17%
|
0%
|
3%
|
4%
|
2%
|
0%
|
0%
|
|
heat pump air-water
|
2%
|
2%
|
1%
|
1%
|
3%
|
0%
|
0%
|
0%
|
2%
|
0%
|
0%
|
0%
|
|
heat pump water-water
|
0%
|
0%
|
1%
|
1%
|
3%
|
0%
|
3%
|
0%
|
0%
|
7%
|
0%
|
0%
|
|
heat pump water-water
|
0%
|
0%
|
0%
|
1%
|
0%
|
0%
|
0%
|
0%
|
0%
|
0%
|
0%
|
0%
|
|
combined wood oil boiler
|
8%
|
18%
|
10%
|
10%
|
11%
|
0%
|
2%
|
6%
|
2%
|
4%
|
0%
|
0%
|
|
solar panels
|
1%
|
1%
|
1%
|
2%
|
0%
|
0%
|
0%
|
0%
|
0%
|
0%
|
0%
|
0%
|
|
other
|
8%
|
2%
|
3%
|
2%
|
3%
|
17%
|
9%
|
17%
|
2%
|
4%
|
0%
|
0%
|
|
no data
|
1%
|
0%
|
0%
|
0%
|
0%
|
0%
|
0%
|
3%
|
1%
|
0%
|
14%
|
0%
|
|
total
|
100%
|
100%
|
100%
|
100%
|
100%
|
100%
|
100%
|
100%
|
100%
|
100%
|
100%
|
100%
|
Statistic S-2.4: Heat distribution and storage of domestic hot water systems
|
percentage of buildings per building class
|
Single Unit Houses
|
Multi Unit Houses
|
||||||||||
|
SUH.01
|
SUH.02
|
SUH.03
|
SUH.04
|
SUH.05
|
SUH.06
|
MUH.01
|
MUH.02
|
MUH.03
|
MUH.04
|
MUH.05
|
MUH.06
|
|
|
local
|
32%
|
15%
|
8%
|
9%
|
9%
|
13%
|
51%
|
44%
|
27%
|
24%
|
0%
|
0%
|
|
floor central
|
12%
|
11%
|
8%
|
10%
|
9%
|
0%
|
25%
|
16%
|
20%
|
27%
|
69%
|
100%
|
|
central
|
56%
|
72%
|
81%
|
80%
|
82%
|
88%
|
14%
|
14%
|
11%
|
32%
|
31%
|
0%
|
|
district heating
|
0%
|
1%
|
3%
|
2%
|
0%
|
0%
|
5%
|
25%
|
42%
|
17%
|
0%
|
0%
|
|
no data
|
0%
|
0%
|
0%
|
0%
|
0%
|
0%
|
5%
|
0%
|
0%
|
0%
|
0%
|
0%
|
|
total
|
100%
|
100%
|
100%
|
100%
|
100%
|
100%
|
100%
|
100%
|
100%
|
100%
|
100%
|
100%
|
Statistic S-2.5: Heat generation of domestic hot water systems
|
percentage of buildings per building class
|
Single Unit Houses
|
Multi Unit Houses
|
||||||||||
|
SUH.01
|
SUH.02
|
SUH.03
|
SUH.04
|
SUH.05
|
SUH.06
|
MUH.01
|
MUH.02
|
MUH.03
|
MUH.04
|
MUH.05
|
MUH.06
|
|
|
heat pump air-water
|
9%
|
7%
|
6%
|
8%
|
11%
|
0%
|
12%
|
0%
|
6%
|
11%
|
0%
|
0%
|
|
solar panels
|
5%
|
2%
|
5%
|
2%
|
6%
|
0%
|
0%
|
0%
|
0%
|
0%
|
0%
|
0%
|
|
electric heater
|
7%
|
6%
|
10%
|
8%
|
6%
|
33%
|
8%
|
27%
|
16%
|
4%
|
0%
|
0%
|
|
fow-through gas boiler
|
11%
|
5%
|
9%
|
8%
|
6%
|
0%
|
16%
|
7%
|
23%
|
28%
|
19%
|
0%
|
|
same as heating
|
65%
|
77%
|
69%
|
72%
|
72%
|
67%
|
52%
|
66%
|
55%
|
52%
|
81%
|
100%
|
|
other
|
2%
|
2%
|
2%
|
2%
|
0%
|
0%
|
12%
|
0%
|
0%
|
4%
|
0%
|
0%
|
|
no data
|
2%
|
0%
|
0%
|
0%
|
0%
|
0%
|
0%
|
0%
|
0%
|
0%
|
0%
|
0%
|
|
total
|
100%
|
100%
|
100%
|
100%
|
100%
|
100%
|
100%
|
100%
|
100%
|
100%
|
100%
|
100%
|
Statistic S-2.7: Ventilation systems
|
percentage of buildings per building class
|
Single Unit Houses
|
Multi Unit Houses
|
||||||||||
|
SUH.01
|
SUH.02
|
SUH.03
|
SUH.04
|
SUH.05
|
SUH.06
|
MUH.01
|
MUH.02
|
MUH.03
|
MUH.04
|
MUH.05
|
MUH.06
|
|
|
natural ventilation
|
100%
|
100%
|
100%
|
100%
|
92%
|
100%
|
100%
|
100%
|
99%
|
99%
|
100%
|
100%
|
|
mechanical ventilation (no heat recovery)
|
0%
|
0%
|
0%
|
0%
|
3%
|
0%
|
0%
|
0%
|
1%
|
1%
|
0%
|
0%
|
|
mechanical ventilation (with heat recovery)
|
0%
|
0%
|
0%
|
0%
|
5%
|
0%
|
0%
|
0%
|
0%
|
0%
|
0%
|
0%
|
|
total
|
100%
|
100%
|
100%
|
100%
|
100%
|
100%
|
100%
|
100%
|
100%
|
100%
|
100%
|
100%
|
Statistic S-2.8: Air-conditioning systems
|
percentage of buildings per building class
|
Single Unit Houses
|
Multi Unit Houses
|
||||||||||
|
SUH.01
|
SUH.02
|
SUH.03
|
SUH.04
|
SUH.05
|
SUH.06
|
MUH.01
|
MUH.02
|
MUH.03
|
MUH.04
|
MUH.05
|
MUH.06
|
|
|
Cooling device installed
|
10%
|
13%
|
12%
|
20%
|
20%
|
22%
|
18%
|
11%
|
10%
|
32%
|
54%
|
0%
|
|
Cooling device not installed
|
90%
|
87%
|
88%
|
80%
|
80%
|
78%
|
82%
|
89%
|
90%
|
68%
|
46%
|
100%
|
|
total
|
100%
|
100%
|
100%
|
100%
|
100%
|
100%
|
100%
|
100%
|
100%
|
100%
|
100%
|
100%
|
Statistic S-2.9: Control of central heating systems
|
percentage of buildings per building class
|
Single Unit Houses
|
Multi Unit Houses
|
||||||||||
|
SUH.01
|
SUH.02
|
SUH.03
|
SUH.04
|
SUH.05
|
SUH.06
|
MUH.01
|
MUH.02
|
MUH.03
|
MUH.04
|
MUH.05
|
MUH.06
|
|
|
no regulation
|
38%
|
24%
|
22%
|
20%
|
21%
|
0%
|
30%
|
51%
|
40%
|
35%
|
17%
|
0%
|
|
termostatic valves only
|
21%
|
18%
|
24%
|
23%
|
29%
|
0%
|
18%
|
23%
|
44%
|
22%
|
0%
|
0%
|
|
room termostat - temperature control
|
23%
|
35%
|
22%
|
24%
|
12%
|
21%
|
29%
|
12%
|
15%
|
21%
|
27%
|
100%
|
|
room termostat - temperature and time control
|
10%
|
14%
|
24%
|
24%
|
33%
|
17%
|
8%
|
8%
|
0%
|
14%
|
56%
|
0%
|
|
outside temperature control
|
2%
|
3%
|
4%
|
3%
|
5%
|
17%
|
15%
|
3%
|
1%
|
5%
|
0%
|
0%
|
|
other
|
6%
|
6%
|
4%
|
7%
|
0%
|
46%
|
0%
|
4%
|
0%
|
2%
|
0%
|
0%
|
|
no data
|
0%
|
0%
|
0%
|
0%
|
0%
|
0%
|
0%
|
0%
|
0%
|
0%
|
0%
|
0%
|
|
total
|
100%
|
100%
|
100%
|
100%
|
100%
|
100%
|
100%
|
100%
|
100%
|
100%
|
100%
|
100%
|
Statistic S-3.1: Domestic Energy Consumption
Final energy consumption of private households by application in Slovenia
| 2009 | 2010 | 2011 | 2012 | |
| Total [TJ] | 50860 | 51841 | 50809 | 49695 |
| Space heating [TJ] | 31938 | 32815 | 31854 | 30940 |
| Extra light heating oil | 8871 | 9411 | 7228 | 6177 |
| Natural gas | 3463 | 3752 | 3718 | 3841 |
| Wood fuels | 14237 | 13949 | 15472 | 15786 |
| Liquefied petroleum gas | 628 | 615 | 721 | 593 |
| Electricity | 1225 | 1319 | 1330 | 1354 |
| Coal | 41 | 31 | 22 | 16 |
| District heat | 3354 | 3567 | 3098 | 2809 |
| Solar energy | 58 | 62 | 65 | 69 |
| Geothermal energy | 61 | 109 | 200 | 295 |
| Water heating [TJ] | 9697 | 9631 | 9651 | 9640 |
| Extra light heating oil | 1955 | 1974 | 1713 | 1574 |
| Natural gas | 710 | 732 | 752 | 802 |
| Wood fuels | 3515 | 3353 | 3595 | 3664 |
| Liquefied petroleum gas | 129 | 120 | 146 | 124 |
| Electricity | 2244 | 2243 | 2262 | 2274 |
| Coal | 5 | 38 | 3 | 2 |
| District heat | 668 | 678 | 644 | 624 |
| Solar energy | 267 | 286 | 304 | 323 |
| Geothermal energy | 204 | 207 | 232 | 253 |
| Other heat appliances [TJ] | 9225 | 9395 | 9304 | 9115 |
| Natural gas | 268 | 277 | 270 | 263 |
| Wood fuels | 307 | 299 | 291 | 282 |
| Liquefied petroleum gas | 826 | 793 | 774 | 754 |
| Electricity | 7824 | 8026 | 7969 | 7816 |
data Source: SURS-
Last updated: 02.09.2014
National Scientific Report Slovenia
Fundamentals and elements of the national residential building typology
Download:<SI_TABULA_ScientificReport_ZRMK.pdf>
(in English Language)
Last updated: 31.05.2012
| Responsible for the content of this page: ZRMK - Building and Civil Engineering Institute (contact information) |
