


- >
- Building Typology>
- COUNTRY PAGES>
- IE Ireland
IE Ireland - Country Page
National Contact Point
| Information about national activities: | National Contact Point Ireland (EPISCOPE) |
| TABULA Building Typology Ireland |
Residential Building Typology
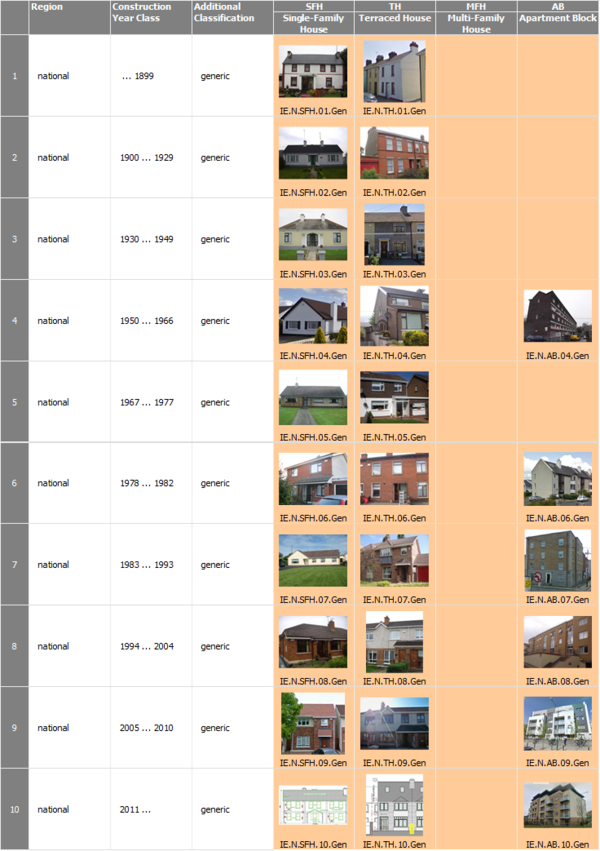
Building Type Matrix
classification scheme for residential buildings --- construction year classes --- pictures of example buildings
(►explanations)
Generic Building Types
Last updated: 02.09.2014
Further Building Types
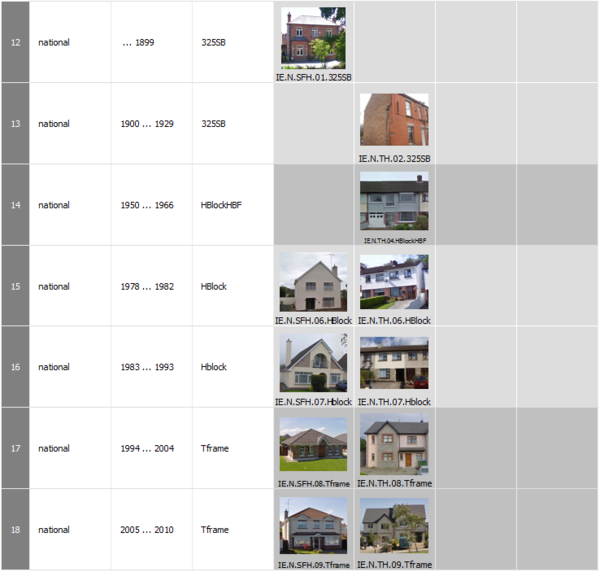
Last updated: 02.09.2014
National Typology Brochure
example buildings --- typical energy consumption values --- effect of refurbishment measures --- building display sheets
(►explanations)
Brochure in English language. (Click on picture to download PDF.)
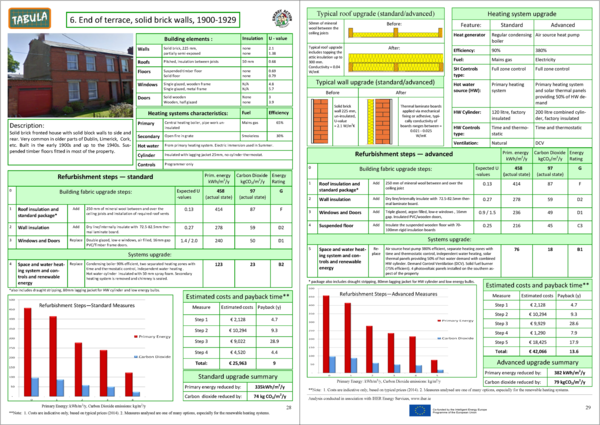
Last updated: 02.09.2014
Statistics of the Irish Building Stock
systematical overview --- available statistics for residential buildings and heat supply systems
(►explanations)
Overview
| Statistical Table | Item | Available | Sources |
| S-1.1 | Frequency of building types of the national building stock | yes | [1] |
| S-1.2.1 | Percentage of thermally refurbished envelope areas | yes | [2] |
| S-1.2.2 | Information on insulation level and window types | ||
| S-2.1 | Centralisation of the heat supply for space heating) | yes | [3] |
| S-2.2 | Heat distribution and storage of space heating systems | ||
| S-2.3 | Heat generation of space heating systems | yes | [4] |
| S-2.4 | Heat distribution and storage of domestic hot water systems | ||
| S-2.5 | Heat generation of domestic hot water systems | ||
| S-2.6 | Solar thermal systems | yes | [5] |
| S-2.7 | Ventilation systems | ||
| S-2.8 | Air-conditioning systems | ||
| S-2.9 | Control of central heating systems | ||
| S-3.1 | Domestic energy consumption | yes | [5] |
[1] source: Census 2011, Table CD432
[2] source: Sustainable Energy Authority of Ireland (SEAI), Department of Community Energy & Local Government (DCELG)
[3] source: Census 2011, Table CD488
[4] sources: CSO Household Budget Survey (2010), Census 2011, SEAI Energy in the Residential Sector 2013, Table 13
[5] source: Sustainable Energy Authority of Ireland (SEAI)
Last updated: 15.11.2013
Statistic S-1.1: Frequency of building types of the national building stock
| All households |
Detached house |
Semi- detached house |
Terraced house |
Flat or apartment in a purpose-built block |
Flat or apartment in a converted house or commercial building |
Bed-sit | Not stated |
|
| Before 1919 | 149,939 | 80,020 | 16,176 | 37,923 | 2,975 | 9,977 | 1,818 | 1,050 |
| 1919 to 1945 | 114,817 | 49,308 | 25,586 | 33,120 | 2,503 | 2,947 | 652 | 701 |
| 1946 to 1960 | 127,691 | 42,961 | 39,045 | 39,047 | 3,573 | 1,735 | 569 | 761 |
| 1961 to 1970 | 114,510 | 42,235 | 42,258 | 23,621 | 4,307 | 1,131 | 331 | 627 |
| 1971 to 1980 | 214,197 | 98,913 | 70,422 | 37,081 | 5,292 | 1,161 | 241 | 1,087 |
| 1981 to 1990 | 172,413 | 87,782 | 48,914 | 24,626 | 8,754 | 1,080 | 257 | 1,000 |
| 1991 to 2000 | 238,724 | 111,618 | 79,107 | 19,021 | 25,626 | 1,962 | 293 | 1,097 |
| 2001 to 2005 | 266,110 | 103,994 | 77,125 | 33,883 | 47,196 | 2,081 | 260 | 1,571 |
| 2006 or later | 171,397 | 69,646 | 39,852 | 21,032 | 37,763 | 1,588 | 210 | 1,306 |
| Not stated | 79,610 | 13,392 | 18,166 | 12,471 | 11,932 | 4,004 | 1,064 | 18,581 |
| Total | 1,649,408 | 699,869 | 456,651 | 281,825 | 149,921 | 27,666 | 5,695 | 27,781 |
Last updated: 31.10.2013
Statistic S-1.2.1: Percentage of Thermally Refurbished Envelope Areas
National energy efficiency programmes which part fund or fully fund thermal upgrades have been under way in Ireland for more than 10 years. Data on measures completed from 2000-2012 is provided in the tables below.
National upgrade programmes have been implemented on low incomes homes since 2000. The low income homes will have typically received one or two measures, e.g. roof insulation and cavity wall insulation. SEAI grant programmes have been available to private homes since 2009 and social housing units have been subject to planned energy upgrades by Local Authorities since 2009.
| SEAI Low Income Homes (Warmer Homes & Areas Scheme) |
Private Homes (SEAI Better Energy Homes) |
Social Housing (DCELG) |
Total |
Measures as % of Total Housing (1.6m) |
|
| 2000-2006 | 11,000 |
11,000 |
0.7% |
||
| 2007 | 4,000 |
4,000 |
0.3% |
||
| 2008 | 5,000 |
5,000 |
0.3% |
||
| 2009 | 15,000 | 18,203 |
1,200 |
34,403 |
2.2% |
| 2010 | 20,000 | 45,946 |
1,800 |
67,746 |
4.2% |
| 2011 | 25,000 | 49,229 |
2,659 |
76,888 |
4.8% |
| 2012 | 14,108 | 26,423 |
2,115 |
42,646 |
2.7% |
| Total | 83,108 | 139,801 | 7,774 |
230,683 |
14.4% |
Last updated: 15.11.2013
The wall upgrade measures implemented since 2007 as part of national SEAI programmes are indicated in the table below. The national housing stock is assumed to be 1.6m dwellings.
| Wall Measures Summary |
Wall Measures (Warmer Homes Scheme) |
Wall Measures (Better Energy Homes) |
Total Wall Measures | Wall Measures as % of Housing Stock |
| 2007 | 1,229 | 1,229 | 0.08% | |
| 2008 | 1,236 | 1,236 | 0.08% | |
| 2009 | 4,372 | 12,628 | 17,000 | 1.06% |
| 2010 | 10,620 | 35,209 | 45,829 | 2.86% |
| 2011 | 11,517 | 39,168 | 50,685 | 3.17% |
| 2012 | 7,990 | 20,096 | 28,086 | 1.76% |
| Total | 36,964 | 107,101 | 144,065 | 9.00% |
The roof upgrade measures implemented since 2007 as part of national SEAI programmes are indicated in the table below. The national housing stock is assumed to be 1.6m dwellings.
| Roof Measures Summary | Roof Measures (Warmer Homes Scheme) | Roof Measures (Better Energy Homes) | Total Roof Measures | Roof Measures as % of Housing Stock |
| 2007 | 2,733 | 2,733 | 0.17% | |
| 2008 | 4,691 | 4,691 | 0.29% | |
| 2009 | 11,021 | 12,254 | 23,275 | 1.45% |
| 2010 | 20,061 | 34,553 | 54,614 | 3.41% |
| 2011 | 18,615 | 36,164 | 54,779 | 3.42% |
| 2012 | 11,360 | 17,274 | 28,634 | 1.79% |
| Total | 68,481 | 100,245 | 168,726 | 10.55% |
Last updated: 15.11.2013
Statistic S-2.1: Centralisation of the Heat Supply (for space heating)
| All house- holds |
No central heating |
Oil | Natural Gas |
Electricity | Coal (incl. anthra- cite) |
Peat (incl. turf) |
Liquid Petroleum Gas (LPG) |
Wood (incl. wood pellets) |
Other fuels |
|
| Before 1919 | 149,939 | 8,938 | 65,676 | 31,179 | 14,278 | 10,910 | 11,603 | 886 | 4,768 | 700 |
| 1919 to 1945 | 114,817 | 4,131 | 45,530 | 36,046 | 6,844 | 9,081 | 9,908 | 455 | 1,924 | 344 |
| 1946 to 1960 | 127,691 | 3,037 | 48,242 | 51,949 | 5,749 | 7,748 | 8,291 | 356 | 1,459 | 291 |
| 1961 to 1970 | 114,510 | 1,677 | 51,583 | 43,456 | 4,596 | 5,751 | 5,194 | 456 | 982 | 302 |
| 1971 to 1980 | 214,197 | 2,482 | 114,508 | 62,161 | 6,290 | 12,226 | 11,741 | 1,141 | 2,364 | 490 |
| 1981 to 1990 | 172,413 | 1,877 | 84,513 | 46,974 | 10,428 | 11,358 | 12,378 | 1,624 | 2,131 | 426 |
| 1991 to 2000 | 238,724 | 1,468 | 107,157 | 80,687 | 26,116 | 9,755 | 8,694 | 1,372 | 1,922 | 598 |
| 2001 to 2005 | 266,110 | 1,198 | 107,784 | 107,149 | 31,390 | 6,290 | 5,644 | 2,187 | 1,893 | 1,514 |
| 2006 or later | 171,397 | 783 | 67,349 | 66,035 | 20,250 | 3,319 | 3,930 | 1,704 | 3,590 | 3,555 |
| Not stated | 79,610 | 1,361 | 18,988 | 24,579 | 14,478 | 2,707 | 1,255 | 271 | 362 | 304 |
| Total | 1,649,408 | 26,952 | 711,330 | 550,215 | 140,419 | 79,145 | 78,638 | 10,452 | 21,395 | 8,524 |
Last updated: 15.11.2013
Statistic S-2.3: Heat generation of space heating systems (combined)
| Fuel Type % | 1987 | 1995 | 2000 | 2005 | 2010 | 2011 Census |
| Solid Fuel | 31% | 21% | 9% | 8% | 4% | 11% |
| Electricity | 1% | 2% | 4% | 3% | 5% | 9% |
| Oil Fired | 12% | 25% | 39% | 46% | 41% | 44% |
| Natural Gas Fired | 4% | 14% | 25% | 28% | 39% | 33% |
| Dual System | 4% | 6% | 7% | 5% | 4% | 0% |
| Geothermal Heat Pump/ Other | 0% | 0% | 0% | 0% | 1% | 1% |
| Partial | 0% | 0% | 0% | 3% | 2% | 0% |
| Total Central Heating | 52% | 68% | 83% | 91% | 97% | 97% |
Last updated: 31.10.2013
Statistic S-2.6: Solar Thermal Systems
The number of grant assisted thermal solar installation installed on existing dwellings is indicated in the table below. Separately, new dwellings built to the 2008 building regulations require a renewable contribution in excess of 10 kWh/m2/year. Solar thermal installations relating to new dwellings are not reported on in this series of tables.
| Grant Approved Solar Thermal Installations (2007-2012) | Greener Homes Solar (houses) | Greener Homes Solar (apartments) | Better Energy Homes Solar (houses) | Better Energy Homes Solar (apartments) | Total SEAI Renewable Grant Solar Installations |
| 2007 | 3,406 | 6 | 3,412 | ||
| 2008 | 6,022 | 20 | 6,042 | ||
| 2009 | 5,707 | 8 | 5,715 | ||
| 2010 | 4,435 | 7 | 4,442 | ||
| 2011 | 3,286 | 6 | 1,166 | 2 | 4,460 |
| 2012 | 2,177 | 2,177 | |||
| Total | 22,856 | 47 | 3,343 | 2 | 26,248 |
Last updated: 15.11.2013
Statistic S-3.1: Domestic energy consumption
Final energy consumption of the private residental sector in Ireland 1900-2012
| Total (Ktoe) | 1990 | 1995 | 2000 | 2005 | 2008 | 2010 | 2011 | 2012 |
| Oil | 389 | 647 | 915 | 1145 | 1197 | 1267 | 1035 | 910 |
| Peat | 725 | 606 | 299 | 273 | 280 | 254 | 241 | 215 |
| Gas | 117 | 252 | 439 | 607 | 669 | 710 | 569 | 600 |
| Electricity* | 356 | 427 | 548 | 646 | 733 | 735 | 712 | 698 |
| Coal | 626 | 246 | 286 | 246 | 230 | 257 | 229 | 239 |
| Renewables | 45 | 30 | 17 | 23 | 37 | 48 | 46 | 53 |
| Total Energy Consumption (Ktoe) | 2258 | 2208 | 2504 | 2940 | 3146 | 3271 | 2832 | 2715 |
*Note this value accounts for the consumption of electricty across the board (Appliances, lighting, etc.), hence the value may need to be adjusted to adequately attain a space and domestic water heating
| Total (Ktoe) | 1990 | 1995 | 2000 | 2005 | 2008 | 2010 | 2011 | 2012 |
| Oil | 389 | 647 | 915 | 1145 | 1197 | 1267 | 1035 | 910 |
| Peat | 725 | 606 | 299 | 273 | 280 | 254 | 241 | 215 |
| Gas | 117 | 252 | 439 | 607 | 669 | 710 | 569 | 600 |
| Electricity* | 113,92 | 136,64 | 175,36 | 206,72 | 234,56 | 235,2 | 227,84 | 223,36 |
| Coal | 626 | 246 | 286 | 246 | 230 | 257 | 229 | 239 |
| Renewables ** | 45 | 30 | 17 | 23 | 37 | 48 | 46 | 53 |
| Total Energy Consumption (Ktoe) | 2015,92 | 1917,64 | 2131,36 | 2500,72 | 2647,56 | 2771,2 | 2347,84 | 2240,36 |
*Note the original values have been multiplied by 0.32 (or 32%), as typically, 7% and 25% of electricty consumption represent Space heating and DHW respectively. (SEAI, 2013 p46)
**Largest contribution to renewables tends to be Biofuel, Solar and Geothermal
Last updated: 02.09.2014
National Scientific Report Ireland
Fundamentals and elements of the national residential building typology
Download:<IE_TABULA_ScientificReport_EnergyAction.pdf>
(in English Language)
Last updated: 27.08.2012
