


- >
- Building Typology>
- COUNTRY PAGES>
- NO Norway
NO Norway - Country Page
National Contact Point
| Information in Norwegian language: | National Contact Point Norway |
Residential Building Typology
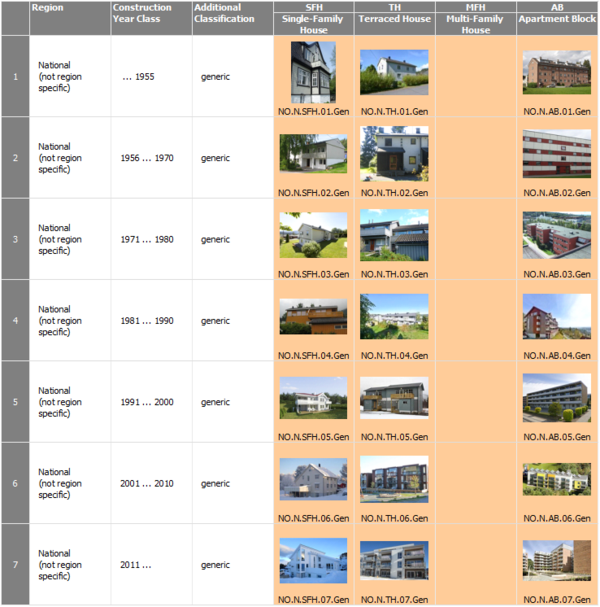
Building Type Matrix
classification scheme for residential buildings --- construction year classes --- pictures of example buildings
(►explanations)
Generic Building Types
Last updated: 02.09.2014
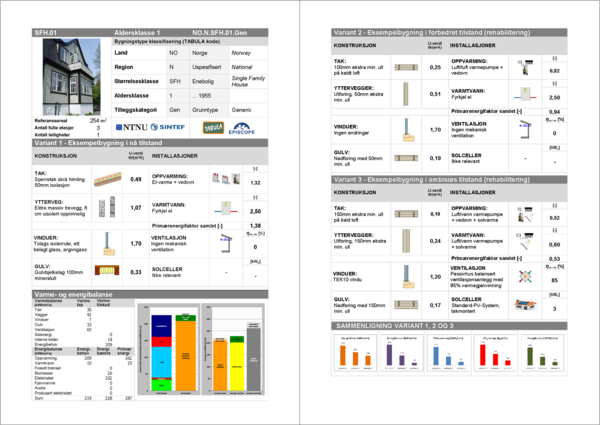
National Typology Brochure
example buildings --- typical energy consumption values --- effect of refurbishment measures --- building display sheets
(►explanations)
Brochure in Norwegian language. (Click on picture to download PDF.)
Last updated: 31.03.2016
Statitstics of the Norwegian Building Stock
systematical overview --- available statistics for residential buildings and heat supply systems
(►explanations)
Overview
| Statistical Table | Item | Available | Sources |
| S-1.1 | Frequency of building types of the national building stock | yes | [1] |
| S-1.2.1 | Percentage of thermally refurbished envelope areas | ||
| S-1.2.2 | Information on insulation level and window types | ||
| S-2.1 | Centralization of the heat supply (for space heating) | yes | [2], [3], [4] |
| S-2.2 | Heat distribution and storage of space heating systems | yes | [2], [3], [4] |
| S-2.3 | Heat generation of space heating systems | yes | [2], [3], [4] |
| S-2.4 | Heat distribution and storage of domestic hot water systems | ||
| S-2.5 | Heat generation of domestic hot water systems | ||
| S-2.6 | Solar thermal systems | ||
| S-2.7 | Ventilation systems | ||
| S-2.8 | Air-conditioning systems | ||
| S-2.9 | Control of central heating systems |
[1] Source: Statistics Norway: Table: 06266: Dwellings, by type of building and year of construction (M) and
Population and housing census, dwellings, 19 November 2011
[2] Source: Statistics Norway: 8 Households by heating equipment combinations for 2001, 2004, 2006 og 2009, by dwelling type
[3] Source: Statistics Norway: 11 Households, by main heating source. 2001, 2004, 2009 and 1993-1995 on average
[4] Source: Statistics Norway: 7 Households with different kinds of heating equipment. 2001, 2004 and 2006
Last updated: 04.04.2016
Statistic S-1.1: Frequency of Building Types of the National Building Stock
Source: Statistics Norway:
Table: 06266: Dwellings, by type of building and year of construction (M) and Population and housing census, dwellings, 19 November 2011
Dwellings and occupied dwellings, by year of construction and type of building, per 31.12.2013.
| Number of buildings (#) | Number of dwellings (#) | Utility floor space (1000 m²) | ||||||||||
| Age classes | SFH | TH | AB | Total | SFH | TH | AB | Total | SFH | TH | AB | Total |
| 1955 and before |
371 183 |
69 020 | 26 955 | 467 158 | 401 482 | 143 241 | 179 666 | 724 389 | 62 677 | 14 765 | 11 816 | 89 258 |
| 1956 - 1970 |
209 324 |
56 769 | 7 419 | 273 512 | 227 929 | 81 577 | 121 358 | 430 864 | 37 288 | 9 656 | 7 614 | 54 557 |
| 1971 - 1980 | 194 861 | 49 848 | 4 546 | 249 255 | 219 673 | 72 521 | 91 387 | 383 581 | 37 204 | 8 523 | 6 565 | 52 292 |
| 1981 - 1990 | 178 291 | 44 391 | 5 296 | 227 978 | 202 228 | 70 619 | 57 471 | 330 318 | 38 202 | 8 014 | 4 300 | 50 516 |
| 1991 - 2000 | 91 914 | 30 924 | 6 319 | 129 157 | 109 696 | 55 632 | 65 056 | 230 384 | 17 912 | 5 586 | 4 437 | 27 935 |
| 2001 - 2010 | 83 819 | 40 468 | 10 450 | 134 737 | 98 808 | 67 624 | 126 975 | 293 407 | 16 525 | 6 977 | 9 006 | 32 508 |
| 2011 and after | 16 695 | 9 623 | 2 280 | 28 598 | 19 144 | 13 929 | 23 194 | 56 267 | 3 433 | 1 570 | 1 866 | 6 869 |
| SUM | 1 146 087 | 301 043 | 63 265 | 1 510 395 | 1 278 960 | 505 143 | 665 107 | 2 449 210 | 213 241 | 55 091 | 45 604 | 313 936 |
| Share occupied dwellings (#) | Number of occupied dwellings (#) | Occupied utility floor space (1000 m²) | ||||||||||
| Age classes | SFH | TH | AB | Total | SFH | TH | AB | Total | SFH | TH | AB | Total |
| 1955 and before | 85.33 | 88.88 | 88.24 | 86.74 | 342 566 | 127 307 | 158 534 | 628 408 | 53 479 | 13 123 | 10 427 | 77 028 |
| 1956 - 1970 | 95.60 | 94.97 | 91.78 | 94.46 | 217 910 | 77 475 | 111 382 | 406 768 | 35 649 | 9 170 | 6 988 | 51 807 |
| 1971 - 1980 | 94.78 | 96.54 | 92.58 | 94.59 | 208 214 | 70 011 | 84 606 | 362 831 | 35 263 | 8 228 | 6 078 | 49 569 |
| 1981 - 1990 | 95.23 | 95.31 | 88.48 | 94.06 | 192 577 | 67 305 | 50 850 | 310 733 | 36 379 | 7 638 | 3 805 | 47 822 |
| 1991 - 2000 | 94.03 | 94.95 | 85.91 | 91.91 | 103 147 | 52 823 | 55 890 | 211 860 | 16 843 | 5 304 | 3 811 | 25 958 |
| 2001 - 2010 | 92.95 | 94.47 | 87.27 | 90.92 | 91 842 | 63 883 | 110 811 | 266 536 | 15 360 | 6 591 | 7 860 | 29 811 |
| 2011 and after | 92.79 | 94.42 | 87.36 | 90.82 | 17 382 | 13 152 | 20 262 | 50 795 | 3 117 | 1 483 | 1 630 | 6 230 |
| SUM | 91.61 | 93.37 | 89.03 | 91.28 | 1 173 638 | 471 957 | 592 335 | 2 237 930 | 196 090 | 51 536 | 40 599 | 288 225 |
The upper part of this table gives the number of residential buildings, dwellings and utility floor space, according to the latest available national building statistics from Statistics Norway. The data are slightly reorganized in order to comply with the age classes used in the EPISCOPE project. With reference to the national statistics the building type classes are as follows:
- SFH (Single-Family House) = Detached house, incl. farm house
- TH (Terraced house) = House with 2 dwellings + Row house, linked house and house with 3 dwellings or more
- AB (Apartment block) = Apartment block incl. residence for communities and other buildings
These values include occupied and vacant (for various reasons non-occupied) dwellings. A small share of the buildings (5.0 %) and dwellings (4.3 %) do not have a known construction year, and these are in our table values assumed constructed before 1955 and hence part of the oldest age class.
The lower table gives the share of occupied dwellings, for each building type and age class, as well as the number of occupied dwellings and utility floor space in occupied dwellings. The values for share of occupied dwellings (%) are taken from Statistics Norway’s Population and Housing Census, 2011, and are slightly modified in order to comply with the age classes used in the EPISCOPE project.
Last updated: 04.04.2016
Statistic S-2.1: Centralization of the Heat Supply (for Space Heating)
Statistic S-2.2: Heat distribution and Storage of Space Heating Systems
Statistic S-2.3: Heat generation of space heating systems (Combined)
Source: Statistics Norway:
Households by heating equipment combinations for 2001, 2004, 2006 og 2009, by dwelling type. Per cent
| Percentage of heating equipment (in given years) sorted by building typology | 2001 | 2004 | 2006 | 2009 | |||
| Total | Total | Total | Total |
SFH Family House |
TH House |
AB Block |
|
| Total | 100 | 100 | 100 | 100 | 100 | 100 | 100 |
| Only electric space heaters | 10 | 10 | 7 | 6 | 1 | 4 | 20 |
| Electric space heaters/ floor heating1 | 11 | 12 | 13 | 12 | 3 | 10 | 33 |
| Electric space heaters and/or electric floor heating + stove for oil/ kerosene and possibly heat pump | 2 | 2 | 2 | 1 | 0 | 2 | 0 |
| Electric stove and/ or electric floor heating and stove for solid fuels | 50 | 46 | 43 | 39 | 45 | 45 | 20 |
| Electric space heater and/or el. floor heating and either both stove for oil/kerosene and solid fuels or combined stove for solid fuels and oil/kerosene and possibly heat pumps or heat recovery4 | 17 | 14 | 13 | 11 | 13 | 16 | 3 |
| Electric space heater and/ or electric floor heating and stove for solid fuels and heat pump, and possibly heat recovery | 0 | 3 | 4 | 13 | 23 | 3 | 0 |
| District heating and other2 | 1 | 1 | 1 | 2 | 0 | 2 | 6 |
| Common or individual central heating total and other, excl. district heating2 | 7 | 10 | 9 | 8 | 6 | 4 | 15 |
| Common central heating and other2, excl. district heating | .. | .. | 4 | 4 | 0 | 2 | 15 |
| Of this individual central heating and other2, excl. district heating | .. | .. | 5 | 4 | 6 | 2 | 0 |
| Heat pump and other2 | .. | 1 | 2 | 2 | 2 | 3 | 1 |
| Gas stove and other | .. | .. | 2 | 2 | 2 | 3 | 1 |
| Electric stoves, stove for fuel wood, and heat recovery5 | .. | .. | .. | 3 | 3 | 5 | 1 |
| Heat recovery and/ or other3 | 1 | 2 | 2 | 2 | 1 | 3 | 1 |
1) Includes also households with ESWA, el. heating devices etc.
2) "Other" includes additional types of heating equipments.
3) This category ncludes unspecified heating equipment combinations, or very uncommon equipment combinations, for instance only stove for fuel wood.
4) About 17 per cent in this group had a heat pump in 2009, while nobody had it for earlier years.
5) About 17 per cent in this group had a heat pump in 2009, while nobody had it for earlier years.
Last updated: 08.11.2013
Source: Statistics Norway
Households, by main heating source1. 2001, 2004, 2009 and 1993-1995 on average. Per cent
|
Percent heating source |
1993-1995 on average |
2001 | 2004 | 2009 |
|
Total |
100.0 | 100.1 | 100.0 | 100.0 |
|
Electric space heaters |
58.3 | 59.8 | 53.8 | 47.7 |
|
Electric floor heating |
6.2 | 9.1 | 8,2 | 7.3 |
|
Heat pump, total |
0.0 | 0.0 | 2.7 | 14.8 |
|
Ambient-air heat pump |
0.0 | 0.0 | 2.0 | 13.5 |
|
Geothermal or ground-source heat pump |
0.0 | 0.0 | 0.7 | 1.3 |
|
Stove for oil/kerosene |
3.7 | 5.4 | 4.2 | 1.2 |
|
Stove for solid fuels |
17.4 | 17.3 | 20.6 | 17.5 |
|
Combined stove for oil and kerosene |
3.4 | 1.3 | 1.9 | 2.0 |
|
Stove for pellets |
.. | .. | .. | 0.4 |
|
Gas stove |
.. | .. | .. | 0.7 |
|
Ventilasjon med varmegjenvinning |
.. | .. | .. | 0.6 |
|
District heating |
0.6 | 0.8 | 0.8 | 2.0 |
|
Individual or common sentral heating, total except district heating2 |
9.5 | 6.0 | 7.6 | 6.0 |
|
Common central heating, without district heating |
4.0 | 4.4 | .. | 3.5 |
|
Egen sentralfyr |
1.6 | .. | 2.5 | |
|
Central heating with oil |
2.1 | 0.4 | 3.2 | 2.6 |
|
Central heating with el |
1.1 | 0.9 | 1.7 | 1.0 |
|
Central heating with wood |
0.4 | 0.1 | 0.0 | 0.1 |
|
Central heating with heat pump or gas |
.. | .. | .. | 0.5 |
|
Other combinations of central heating for several energy types |
1,9 | 0.2 | 1.4 | 1.4 |
|
Unknown central heating |
- | - | 1.4 | 0.5 |
|
Other heating equipment3 |
0.9 | 0.4 | 0.3 | 0.1 |
1) We do not have information about main heating source in 2006.
2) For 1993-1995 and 2001, its only individual central heating that is distributed on type (oil, el. etc.). For 2004, individual and common central heating is reported together as "central heating", and common central heating is divided on type (el, oil, wood), where this information is given, In other cases its placed on "unknown" central heating. For 2009, individual and common central heating is reported separately but the division on type (oil, electricity etc.) refers to both common and individual central heating.
3) For 2009, this is open stove for fuel wood.
Last updated: 08.11.2013
Source: Statistics Norway
Households with different kinds of heating equipment. 2001, 2004 and 2006. Per cent
| Percent of dwellings with different heating equipment |
2001 | 2004 | 2006 | 2009 | |||
| Total | Total | Total | Total |
SFH Family House |
TH House |
AB Block |
|
| Electric space heaters or electric floor heating | 97 | 97 | 98 | 94.8 | 97 | 93 | 92 |
| Stove for oil/ kerosene | 15 | 11 | 16 | 5.0 | 7 | 7 | 0 |
| Stove for solid fuels/ open fire place | 69 | 65 | 69 | 67.3 | 88 | 64 | 26 |
| Stove for pellets | .. | .. | 0.3 | 0.7 | 1 | 1 | 0 |
| Open fire place | .. | .. | 13 | 9.5 | 14 | 6 | 4 |
| Closed stove for fuel wood | .. | .. | 67 | 64.6 | 84 | 62 | 24 |
| Combined stove for fuel wood and oil | 10 | 8 | 7 | 10.5 | 12 | 14 | 3 |
| Stove for oil/ kerosene and/or combined stove for fuel wood and oil1 | 20 | 17 | 19 | 13.7 | 16 | 19 | 3 |
| Stove for solid fuel/ open fire place and/ or combined stove for fuel wood and oil1 | 72 | 68 | 70 | 71.9 | 92 | 73 | 27 |
| Open fire place + other heating equipment, but not closed stove for fuel wood | .. | .. | 2 | 2.7 | 4 | 2 | 2 |
| Common or individual central heating total, excl. district heating | 7 | 9 | 9 | 8.0 | 6 | 4 | 15 |
| Common central heating, except district heating | 5 | 4 | 4.2 | 0 | 2 | 15 | |
| Individual central heating | 2 | 5 | 3.9 | 6 | 2 | 0 | |
| District heating | 1 | 1 | 1 | 2.0 | 0 | 2 | 6 |
| Heat pump total | .. | 4 | 8 | 18.5 | 33 | 8 | 2 |
| Ambient-air heat pump | .. | 3 | 7 | 16.8 | 31 | 8 | 1 |
| Geothermal or ground-source heat pump | 0.1 | 0.8 | 1 | 1.8 | 2 | 1 | 1 |
| Heat recovery | 5 | 7.3 | 8 | 9 | 7 | ||
| Gas stove | 2 | 2.5 | 3 | 3 | 3 | ||
| Other | 2 | 2 | .. | .. | .. | .. | .. |
1) Some households have combined stove for oil and wood in addition to stove for only fuel wood or oil. These are added up here in order to better illustrate the share of households who in reality can use oil or fuel wood.
Last updated: 08.11.2013
| Responsible for the content of this page: NTNU - Norwegian University of Science and Technology (contact information) |
