


- >
- Building Typology>
- COUNTRY PAGES>
- NL The Netherlands
NL The Netherlands - Country Page
National Contact Point
Information in Dutch language: National Contact Point The Netherlands
Residential Building Typology
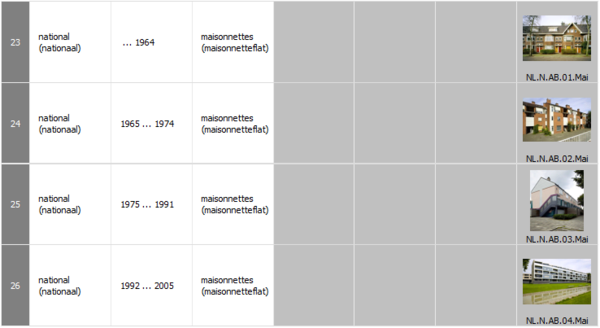
Building Type Matrix
classification scheme for residential buildings --- construction year classes --- pictures of example buildings
(►explanations)
Generic Building Types
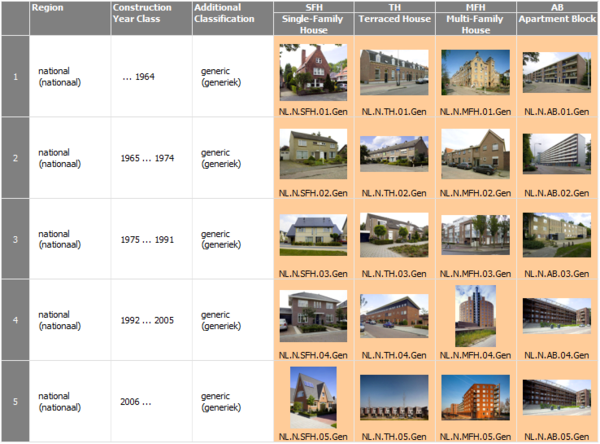
Last updated: 02.09.2014
Further Building Types
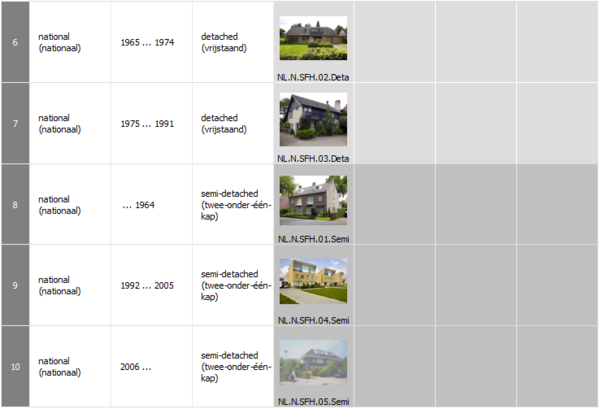
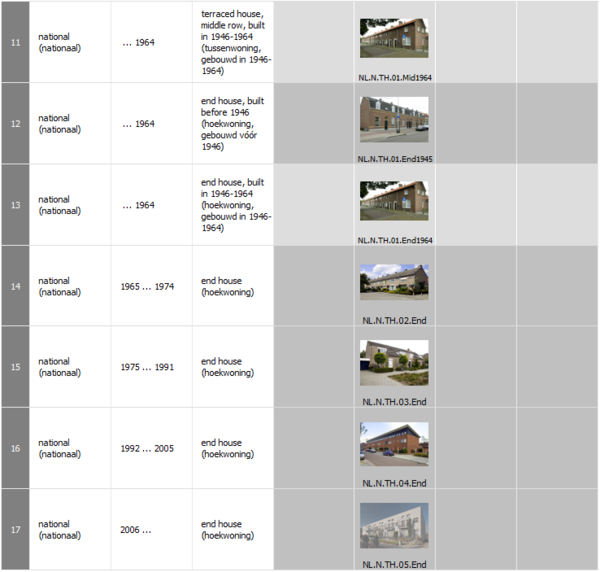
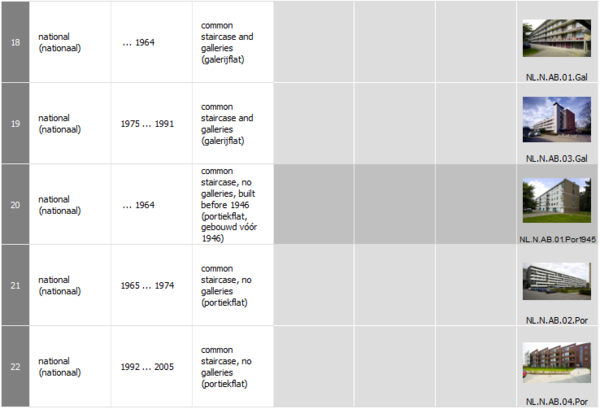
Last updated: 02.09.2014
National Typology Brochure
External links to national Dutch typology brochures
Brochure with reference dwellings and the impact of refurbishment measures:
Agentschap NL (2011): Voorbeeldwoningen 2011
Brochure describing standards for new dwelllings (incl. NZEB):
Agentschap NL (2013): Referentiewoningen nieuwbouw 2013
Last updated: 06.06.2014
Statistcs of the Dutch Building Stock
systematical overview --- available statistics for residential buildings and heat supply systems
(►explanations)
Overview
| Statistical Table | Item | Available | Sources |
| S-1.1 | Frequency of building types of the national building stock | yes | [1] |
| S-1.2.1 | Percentage of thermally refurbished envelope areas | yes | [2] |
| S-1.2.2 | Information on insulation level and window types | no | |
| S-2.1 | Centralisation of the heat supply (for space heating) | yes | [2] |
| S-2.2 | Heat distribution and storage of space heating systems | no | |
| S-2.3 | Heat generation of space heating systems | yes | [2] |
| S-2.4 | Heat distribution and storage of domestic hot water systems | no | |
| S-2.5 | Heat generation of domestic hot water systems | yes | [2] |
| S-2.6 | Solar thermal systems | no | |
| S-2.7 | Ventilation systems | rough estimations | [3] |
| S-2.8 | Air-conditioning systems | no | |
| S-2.9 | Control of central heating systems | no |
|
| S-3.1 | Domestic energy consumption | yes | [4] |
[1] AgentschapNL, Voorbeeldwoningen 2011; bestaande bouw
[2] Housing Survey 2012, Energy module / Cijfers over Wonen en Bouwen 2013
[3] estimations given at
www.milieucentraal.nl/thema's/thema-1/energie-besparen/isoleren-en-besparen/ventilatie-noodzakelijk-voor-gezondheid/
[4] Sources: StatLine Statistics Netherlands (CBS) Feb. 7 2014
Last updated: 04.09.2014
Statistic S-1.1: Frequency of Building Types of the National Building Stock
|
Number of dwellings (x 1000) on 1-1-2012 |
De- tached house |
Semi- detached house |
Terraced house, mid-row |
Terraced house, end-row |
Flat with common staircase and galleries |
Flat with common staircase, no galleries* |
Maison- nette* |
Other multi- familiy dwelling* |
Total |
| Before 1946 | 441 | 285 | 337 | 186 | 69 | 256 | 226 | 99 | 2644 |
| 1946 to 1964 | 296 | 182 | 267 | ||||||
| 1965 to 1974 | 119 | 142 | 375 | 231 | 174 | 112 | 22 | 125 | 1300 |
| 1975 to 1991 | 221 | 224 | 572 | 307 | 109 | 142 | 94 | 125 | 1794 |
| 1992 to 2005 | 178 | 173 | 241 | 112 | 113 | 70 | 40 | 136 | 1063 |
| 2006 to 2011 | 78 | 76 | 106 | 48 | 49 | 31 | 17 | 60 | 465 |
| Total | 1037 | 900 | 1927 | 1066 | 514 | 878 | 399 | 545 | 7266 |
* As for the 2006-2011 period, the flats with common staircase and no galleries, the maisonnettes and the other multi-family dwellings belong to the same class. Nevertheless, the numbers of dwellings are given per building type.
Last updated: 01.09.2014
Statistic S-1.2.1: Percentage of Thermally Refurbished Envelope Area
| Percentage of dwellings in 2012 | Total |
| ground floor | 56 % |
| wall | 70 % |
| roof | 79 % |
| glazing | 86 % |
Source: Housing Survey 2012, Energy module / Cijfers over Wonen en Bouwen 2013, p. 136
Last updated: 08.11.2013
Statistic S-2.1 and S-2.3: Percentage of Types of Heat Supply
| Percentage of dwellings in 2012 | Total |
| individual local heating | 3 % |
| individual central heating: - non-condensing boiler - condensing boiler |
13 % 72 % |
| district heating | 7 % |
| other (delivery of warmth by third parties) | 4 % |
Source: Housing Survey 2012, Energy module / Cijfers over Wonen en Bouwen 2013, p. 137-138
Last updated: 08.11.2013
Statistic S-2.5: Heat Generation of Domestic Hot Water Systems
|
Percentage of dwellings in 2012 |
Total |
|
kitchen geyser |
5 % |
|
bath geyser |
3 % |
|
gas boiler |
1 % |
|
electric boiler |
4 % |
|
common boiler for heating and dhw |
80 % |
|
solar boiler |
0 % |
|
individual heat pump |
1 % |
|
collective facility |
3 % |
|
other (delivery of warmth by third parties) |
4 % |
Source: Housing Survey 2012, Energy module / Cijfers over Wonen en Bouwen 2013, p. 139
Last updated: 08.11.2013
Statistic S-2.7: Ventilation Systems
| Percentage of dwellings in 2012 | Total |
| natural ventilation | ± 67 % |
| exhaust air ventilation | ± 30 % |
| balanced ventilation | ± 3 % |
Source: estimations given at
www.milieucentraal.nl/thema's/thema-1/energie-besparen/isoleren-en-besparen/ventilatie-noodzakelijk-voor-gezondheid/
Last updated: 08.11.2013
Statistic S-3.1: Domestic energy consumption
Energy consumption sector private households; energy commodities
| 1995 | 2000 | 2005 | 2010 | 2011 | 2012 | |
| Total (PJ) | 454,94 | 432,35 | 424,61 | 478,84 | 404,72 | 429,25 |
| Primary coal (PJ) | 0,23 | 0,20 | 0,2 | 0,23 | 0,16 | 0,2 |
| Petroleum products (PJ) | 6,17 | 3,65 | 3,79 | 4,37 | 3,08 | 3,68 |
| Lpg (PJ) | 1,42 | 0,94 | 1 | 1,15 | 0,82 | 0,97 |
| Other kerosene (PJ) | 0,69 | 0,56 | 0,58 | 0,67 | 0,45 | 0,56 |
| Gas/diesel oil (PJ) | 4,06 | 2,15 | 2,21 | 2,55 | 1,81 | 2,15 |
| Natural gas (PJ) | 360,81 | 333,59 | 314,92 | 361,76 | 294,35 | 312,54 |
| Electricity (PJ) | 70,92 | 78,48 | 87,12 | 88,76 | 85,06 | 89,46 |
| Heat (PJ) | 6,89 | 6,07 | 7,81 | 11,36 | 9,64 | 10,5 |
| Space Heating | 295,68 | 275,31 | 261,85 | 299,10 | 245,30 | 260,33 |
| Gas | 285,04 | 263,54 | 248,79 | 285,79 | 232,54 | 246,91 |
| Electricity (including domestic hot water) | 10,64 | 11,77 | 13,07 | 13,31 | 12,76 | 13,42 |
| Domestic Hot Water | 68,55 | 63,38 | 59,83 | 68,73 | 55,93 | 59,38 |
| Gas | 68,55 | 63,38 | 59,83 | 68,73 | 55,93 | 59,38 |
| Electricity (included in space heating) | - | - | - | - | - | - |
| Other Applications | 37,00 | 39,63 | 42,89 | 44,51 | 41,61 | 43,82 |
| Gas for cooling | 7,22 | 6,67 | 6,30 | 7,24 | 5,89 | 6,25 |
| Electricity for cooling | 12,06 | 13,34 | 14,81 | 15,09 | 14,46 | 15,21 |
| Electricity for cooking | 3,55 | 3,92 | 4,36 | 4,44 | 4,25 | 4,47 |
| Electricity for ICT | 10,64 | 11,77 | 13,07 | 13,31 | 12,76 | 13,42 |
| Electricity Other | 3,55 | 3,92 | 4,36 | 4,44 | 4,25 | 4,47 |
| Lighting (Electricity) | 11,35 | 12,56 | 13,94 | 14,20 | 13,61 | 14,31 |
http:Notes: The percentages used for each application are based on 2010 values according to //www.government.nl/issues/energy/energy-and-the-economy
Sources: StatLine Statistics Netherlands (CBS) Feb. 7 2014
| Responsible for the content of this page: DUT - Delft University of Technology (contact information) |
