


- >
- Building Typology>
- COUNTRY PAGES>
- IT Italy
IT Italy - Country Page
National Contact Point
| Information in Italian language: | National Contact Point Italy (EPISCOPE) |
| TABULA Building Typology Italy |
Residential Building Typology
Building Type Matrix
classification scheme for residential buildings --- construction year classes --- pictures of example buildings
(►explanations)
Generic Building Types - Middle Climatic Zone

Last updated: 02.09.2014
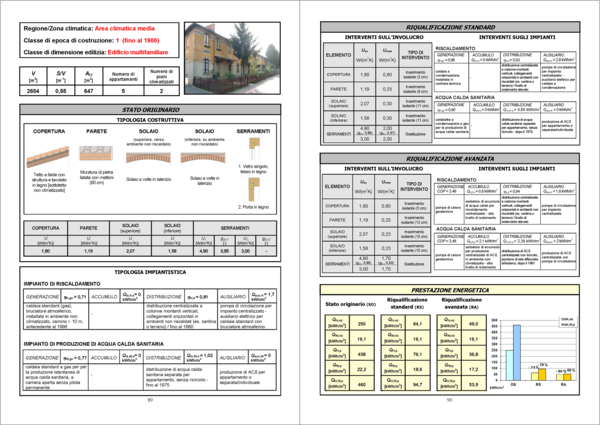
National Typology Brochure
example buildings --- typical energy consumption values --- effect of refurbishment measures --- building display sheets
(►explanations)
Brochure in Italian language. (Click on picture to download PDF.)
Last updated: 02.09.2014
Statistics of the Italian Building Stock
systematical overview --- available statistics for residential buildings and heat supply systems
(►explanations)
Overview
| Statistical Table | Item | Available | Remarks |
| S-1.1 |
Frequency of building types of the regional building stock (Piedmont) |
yes | [1] |
| S-1.2.1 |
Percentage of thermally refurbished envelope areas |
yes | [2], [3] |
| S-1.2.2 |
Information on insulation level and window types |
no | |
| S-2.1 |
Centralisation of the heat supply (for space heating) |
yes | [1] |
| S-2.2 |
Heat distribution and storage of space heating systems |
no | |
| S-2.3 |
Heat generation of space heating systems |
yes | [1] |
| S.2-4 |
Heat distribution and storage of domestic hot water systems |
no | |
| S-2.5 |
Heat generation of domestic hot water systems |
yes | [1] |
| S-2.6 |
Solar thermal systems |
yes | [1], [4] |
| S-2.7 |
Ventilation systems |
no | |
| S-2.8 |
Air-conditioning systems |
no | |
| S-2.9 |
Control of central heating systems |
no | |
| S-3.1 | Domestic energy consumption | yes | [5] |
[1] Source: National Institute of Statistics, ISTAT, Census 2011.
[2] Source: National Institute of Statistics, ISTAT, Census 2001.
[3] No available data on thermally refurbished envelope areas but on type of intervention for age of construction.
[4] Only for DHW, no information on heating.
[5] Italian National Agency for New Technologies, Energy and Sustainable Economic Development (ENEA). "Rapporto Energia e Ambiente 2009-2010", 2012; National Institute of Statistics (ISTAT), Report 2004.
Last updated: 24.09.2015
NOTE: The available statistical data are split by region in the reference source. In the statistical tables, the regional data are merged considering three different groups of regions, as shown in the table below.
| CLIMATIC ZONE | ITALIAN REGIONS | CLUSTERING CRITERION | |
| Mediterranean | Abruzzo, Basilicata, Calabria, Campania, Lazio, Liguria, Puglia, Sardegna, Sicilia, Toscana |
Most of the municipalities of the region having a number of heating degree-days: |
up to 2100 |
| Middle | Emilia Romagna, Friuli Venezia Giulia, Lombardia, Marche, Molise, Piemonte, Umbria, Veneto | from 2100 to 3000 | |
| Alpine | Trentino Alto Adige, Valle d’Aosta | more than 3000 | |
Last updated: 24.09.2015
Statistics S-1.1: Frequency of Building Types of the National Building Stock (Piedmont)
| PIEDMONT REGION | ||||
| Construction age | SFH 1 apartment |
MFH ≥ 2 apartments |
||
| number of buildings | number of apartments | number of buildings | number of apartments | |
| Before 1919 | 190,029 | 190,029 | 89,474 | 277,469 |
| 1919 - 1945 | 91,486 | 91,486 | 53,526 | 211,520 |
| 1946 - 1960 | 61,708 | 61,708 | 52,112 | 272,257 |
| 1961 - 1970 | 62,542 | 65,542 | 66,102 | 420,949 |
| 1971 - 1980 | 57,276 | 57,276 | 56,210 | 326,911 |
| 1981 - 1990 | 32,839 | 32,839 | 28,208 | 156,741 |
| 1991 - 2000 | 27,584 | 27,584 | 19,725 | 98,252 |
| 2001 - 2005 | 18,088 | 18,088 | 12,170 | 68,386 |
| After 2005 | 16,018 | 16,018 | 9,593 | 53,717 |
| TOTAL | 555,570 | 557,570 | 387,120 | 1,886,202 |
Last updated: 24.09.2015
| MIDDLE CLIMATIC REGIONS | ||||
| Construction age | SFH 1 apartment |
MFH ≥ 2 apartments |
||
| number of buildings | number of apartments | number of buildings | number of apartments | |
| Before 1919 | 546,667 | 546,667 | 364,782 | 1,252,383 |
| 1919 - 1945 | 330,754 | 330,754 | 232,776 | 885,486 |
| 1946 - 1960 | 372,840 | 372,840 | 345,000 | 1,506,876 |
| 1961 - 1970 | 415,190 | 415,190 | 486,783 | 2,331,452 |
| 1971 - 1980 | 399,082 | 399,082 | 459,929 | 2,099,946 |
| 1981 - 1990 | 242,287 | 242,287 | 265,212 | 1,239,523 |
| 1991 - 2000 | 175,838 | 175,838 | 189,973 | 919,465 |
| 2001 - 2005 | 102,964 | 102,964 | 118,095 | 648,027 |
| After 2005 | 87,824 | 87,824 | 97,659 | 560,992 |
| TOTAL | 2,673,446 | 2,673,446 | 2,560,209 | 11,444,150 |
| ALPINE REGIONS | ||||
| Construction age | SFH 1 apartment |
MFH ≥ 2 apartments |
||
| number of buildings | number of apartments | number of buildings | number of apartments | |
| Before 1919 | 30,528 | 30,528 | 31,723 | 107,419 |
| 1919 - 1945 | 9,615 | 9,615 | 10,924 | 40,625 |
| 1946 - 1960 | 11,247 | 11,247 | 14,633 | 64,939 |
| 1961 - 1970 | 15,069 | 15,069 | 19,808 | 93,147 |
| 1971 - 1980 | 15,740 | 15,740 | 19,248 | 94,989 |
| 1981 - 1990 | 12,816 | 12,816 | 13,070 | 60,521 |
| 1991 - 2000 | 12,923 | 12,923 | 11,024 | 49,471 |
| 2001 - 2005 | 7,069 | 7,069 | 6,031 | 28,316 |
| After 2005 | 6,788 | 6,788 | 5,900 | 28,853 |
| TOTAL | 121,795 | 121,795 | 132,361 | 568,280 |
| MEDITERRANEAN REGIONS | ||||
| Construction age | SFH 1 apartment |
MFH ≥ 2 apartments |
||
| number of buildings | number of apartments | number of buildings | number of apartments | |
| Before 1919 | 513,024 | 513,024 | 345,780 | 1,206,521 |
| 1919 - 1945 | 459.393 | 459.393 | 283,545 | 1,073,534 |
| 1946 - 1960 | 555.928 | 555.928 | 401,188 | 1,757,008 |
| 1961 - 1970 | 583.742 | 583.742 | 530,241 | 2,547,448 |
| 1971 - 1980 | 634.778 | 634.778 | 588,874 | 2,526,416 |
| 1981 - 1990 | 505.969 | 505.969 | 423,413 | 1,813,845 |
| 1991 - 2000 | 269.900 | 269.900 | 211,359 | 883,979 |
| 2001 - 2005 | 132.922 | 132.922 | 98,023 | 429,147 |
| After 2005 | 90.849 | 90.849 | 70,959 | 346,204 |
| TOTAL | 3.746.505 | 3.746.505 | 2,953,382 | 12,584,102 |
Statistics S-1.2.1: Percentage of Thermally Refurbished Envelope Areas
Percentage of refurbished apartments
| PIEDMONT REGION | ||
| Construction age | Not refurbished apartments | Refurbished apartments |
| Before 1919 | 48.5 % | 51.5 % |
| 1919 - 1945 | 46.7 % | 53.3 % |
| 1946 - 1961 | 45.6 % | 54.4 % |
| 1962 - 1971 | 45.4 % | 54.6 % |
| 1972 - 1981 | 47.4 % | 52.6 % |
| 1982 - 1991 | 58.7 % | 41.3 % |
| After 1991 | 75.6 % | 24.4 % |
| On the whole | 49.3 % | 50.7 % |
Last updated: 15.11.2013
Percentage of refurbished apartments
| MIDDLE CLIMATIC REGIONS | ||
| Construction age | Not refurbished apartments | Refurbished apartments |
| Before 1919 | 46.6 % | 53.4 % |
| 1919 - 1945 | 44.9 % | 55.1 % |
| 1946 - 1961 | 41.8 % | 58.2 % |
| 1962 - 1971 | 40.6 % | 59.4 % |
| 1972 - 1981 | 43.1 % | 56.9 % |
| 1982 - 1991 | 57.0 % | 43.0 % |
| After 1991 | 77.1 % | 22.9 % |
| On the whole | 47.5 % | 52.5 % |
| ALPINE REGIONS | ||
| Construction age | Not refurbished apartments | Refurbished apartments |
| Before 1919 | 49.2 % | 50.8 % |
| 1919 - 1945 | 45.7 % | 54.3 % |
| 1946 - 1961 | 41.0 % | 59.0 % |
| 1962 - 1971 | 39.7 % | 60.3 % |
| 1972 - 1981 | 44.0 % | 56.0 % |
| 1982 - 1991 | 59.4 % | 40.6 % |
| After 1991 | 69.9 % | 30.1 % |
| On the whole | 48.6 % | 51.4 % |
| MEDITERRANEAN REGIONS | ||
| Construction age | Not refurbished apartments | Refurbished apartments |
| Before 1919 | 56.1 % | 43.9 % |
| 1919 - 1945 | 56.9 % | 43.1 % |
| 1946 - 1961 | 53.7 % | 46.3 % |
| 1962 - 1971 | 52.1 % | 47.9 % |
| 1972 - 1981 | 55.3 % | 44.7 % |
| 1982 - 1991 | 64.4 % | 35.6 % |
| After 1991 | 76.3 % | 23.7 % |
| On the whole | 57.2 % | 42.8 % |
Percentage of refurbishment types
| PIEDMONT REGION | |||
| Construction age | Refurbishment on technical systems | Refurbishment on structural elements | Refurbishment on no-structural elements |
| Before 1919 | 46.6 % | 15.0 % | 38.4 % |
| 1919 - 1945 | 48.4 % | 12.0 % | 39.6 % |
| 1946 - 1961 | 51.1 % | 7.7 % | 41.2 % |
| 1962 - 1971 | 52.1 % | 6.5 % | 41.4 % |
| 1972 - 1981 | 53.6 % | 6.7 % | 39.7 % |
| 1982 - 1991 | 53.1 % | 8.3 % | 38.6 % |
| After 1991 | 41.2 % | 20.4 % | 38.4 % |
| On the whole | 50.2 % | 9.8 % | 40.0 % |
Last updated: 15.11.2013
Percentage of refurbishment types
| MIDDLE CLIMATIC REGIONS | |||
| Construction age | Refurbishment on technical systems | Refurbishment on structural elements | Refurbishment on no-structural elements |
| Before 1919 | 47.2 % | 15.3 % | 37.5 % |
| 1919 - 1945 | 49.1 % | 12.4 % | 38.5 % |
| 1946 - 1961 | 52.0 % | 8.8 % | 39.2 % |
| 1962 - 1971 | 53.1 % | 7.6 % | 39.3 % |
| 1972 - 1981 | 54.8 % | 7.0 % | 38.2 % |
| 1982 - 1991 | 54.3 % | 7.8 % | 37.9 % |
| After 1991 | 42.2 % | 18.5 % | 39.3 % |
| On the whole | 51.5 % | 9.9 % | 38.6 % |
| ALPINE REGIONS | |||
| Construction age | Refurbishment on technical systems | Refurbishment on structural elements | Refurbishment on no-structural elements |
| Before 1919 | 43.2 % | 17.6 % | 39.2 % |
| 1919 - 1945 | 45.2 % | 13.9 % | 40.9 % |
| 1946 - 1961 | 47.1 % | 10.3 % | 42.6 % |
| 1962 - 1971 | 47.6 % | 9.1 % | 43.3 % |
| 1972 - 1981 | 48.2 % | 8.5 % | 43.3 % |
| 1982 - 1991 | 47.3 % | 9.7 % | 43.0 % |
| After 1991 | 38.4 % | 24.1 % | 37.5 % |
| On the whole | 45.7 % | 12.7 % | 41.6 % |
| MEDITERRANEAN REGIONS | |||
| Construction age | Refurbishment on technical systems | Refurbishment on structural elements | Refurbishment on no-structural elements |
| Before 1919 | 45.4 % | 13.9 % | 40.7 % |
| 1919 - 1945 | 46.8 % | 10.9 % | 42.3 % |
| 1946 - 1961 | 49.1 % | 7.5 % | 43.4 % |
| 1962 - 1971 | 50.8 % | 6.4 % | 42.8 % |
| 1972 - 1981 | 51.2 % | 6.6 % | 42.2 % |
| 1982 - 1991 | 49.8 % | 7.6 % | 42.6 % |
| After 1991 | 43.2 % | 15.7 % | 41.1 % |
| On the whole | 49.0 % | 8.6 % | 42.4 % |
Statistics S-2.1: Centralisation of the Heat Supply (for Space Heating)
| PIEDMONT REGION | |
| Central heating system for several dwellings | 34.7 % |
| Individual heating system for a single dwelling | 49.0 % |
| Single heating devices for dwelling as a whole | 6.2 % |
| Single heating devices for part of dwelling | 10.1 % |
Last updated: 24.09.2015
| MIDDLE CLIMATIC REGIONS |
ALPINE REGIONS |
MEDITERRANEAN REGIONS |
On the whole | |
| Central heating system for several dwellings | 21.5 % | 35.3 % | 14.7 % | 18.8 % |
| Individual heating system for a single dwelling | 60.7 % | 36.4 % | 61.6 % | 60.5 % |
| Single heating devices for dwelling as a whole | 6.4 % | 8.9 % | 10.3 % | 8.2 % |
| Single heating devices for part of dwelling | 11.4 % | 19.5 % | 13.4 % | 12.5 % |
Statistics S-2.3: Heat Generation of Space Heating Systems
| PIEDMONT REGION | |
| Natural gas | 70.5 % |
| Gas oil | 6.2 % |
| LPG (Liquified Petroleum Gas) | 3.2 % |
| Soli fuel (wood, coal) | 14.0 % |
| Fuel oil | 0.2 % |
| Electricity | 1.5 % |
| Other fuel or energy | 4.4 % |
Last updated: 24.09.2015
| MIDDLE CLIMATIC REGIONS | ALPINE REGIONS | MEDITERRANEAN REGIONS | On the whole | |
| Natural gas | 73.9 % | 43.0 % | 64.1 % | 68.7 % |
| Gas oil | 4.7 % | 16.4 % | 4.7 % | 4.9 % |
| LPG (Liquified Petroleum Gas) | 3.0 % | 3.9 % | 6.5 % | 4.6 % |
| Solid fuel (wood, coal) | 12.9 % | 28.9 % | 15.1 % | 14.3 % |
| Fuel oil | 0.1 % | 1.2 % | 0.1 % | 0.1 % |
| Electricity | 3.0 % | 1.5 % | 8.0 % | 5.2 % |
| Other fuel or energy | 2.4 % | 5.1 % | 1.6 % | 2.1 % |
Statistics S-2.5: Heat generation of Domestic Hot Water Systems
| PIEDMONT REGION | |
| Dwellings without hot water system | 0.8 % |
| Dwellings with hot water system - heating and hot water generated by the same system | 62.8 % |
| Dwellings with hot water system - hot water generated by system different from heating system | 36.4 % |
Last updated: 24.09.2015
| MIDDLE CLIMATIC REGIONS | ALPINE REGIONS | MEDITERRANEAN REGIONS | On the whole | |||
| Dwellings without hot water system | 0.6 % | 1.0 % | 0.7 % | 0.6 % | ||
| Dwellings with hot water system - heating and hot water generated by the same system | 78.1 % | 77.8 % | 71.1 % | 74.8 % | ||
| Dwellings with hot water system - hot water generated by system different from heating system | 21.4 % | 21.2 % | 28.2 % | 24.5 % | ||
Statistics S-2.6: Solar thermal systems
| PIEDMONT REGION | ||
| Dwellings with hot water system - hot water generated by system different from heating system |
Electricity system | 34.8 % |
| Solar thermal system | 4.1 % | |
| Other system type | 61.1 % | |
Last updated: 24.09.2015
| MIDDLE CLIMATIC REGIONS |
ALPINE REGIONS |
MEDITERRANEAN REGIONS |
On the whole | ||||
|
Dwellings with hot water system - different from heating system |
Electricity system | 27.3 % | 30.4 % | 54.3 % | 41.7 % | ||
| Solar thermal system | 7.0 % | 30.4 % | 4.1 % | 5.9 % | |||
| Other system type | 65.7 % | 39.3 % | 41.6 % | 52.4 % | |||
Statistic S-3.1: Domestic energy consumption
Italy
| Primary energy [kWh/m2] | 1990 | 1995 | 2000 | 2005 | 2006 | 2007 | 2008 | 2009 |
| Total energy consumption | 151 | 155 | 147 | 160 | 148 | 144 | 151 | 156 |
| Space heating* | 104,9 | 106,4 | 97,6 | 107,8 | 97,5 | 93,7 | 100,1 | 104,7 |
| Domestic hot water* | 17,3 | 17,5 | 17,4 | 16,5 | 15,4 | 14,8 | 15,1 | 15,2 |
| Cooking | 9,92 | 9,77 | 9,30 | 9,54 | 9,51 | 9,57 | 9,64 | 9,36 |
| Lighting and other electrical appliances | 19,2 | 20,9 | 22,7 | 25,7 | 26,0 | 25,9 | 26,3 | 26,6 |
* referred to the buildings with a thermal system, not to the entire residential building stock
Sources: Italian National Agency for New Technologies, Energy and Sustainable Economic Development (ENEA). "Rapporto Energia e Ambiente 2009-2010", 2012; National Institute of Statistics (ISTAT), Report 2004
| Primary energy [GWh] | 1990 | 1995 | 2000 | 2005 | 2006 | 2007 | 2008 | 2009 |
| Total energy consumption | 292.063 | 298.421 | 284.079 | 308.456 | 287.281 | 278.788 | 292.555 | 301.587 |
| Space heating | 200.611 | 203.414 | 186.577 | 206.209 | 186.472 | 179.256 | 191.422 | 200.200 |
| Liquefied petroleum gas | 10.495 | 11.444 | 11.858 | 11.984 | 11.111 | 10.643 | 11.018 | 10.847 |
| Natural gas | 106.129 | 130.685 | 118.951 | 140.569 | 124.614 | 120.071 | 129.437 | 137.741 |
| Gasoil | 70.594 | 47.028 | 38.834 | 35.365 | 30.912 | 24.156 | 25.226 | 23.937 |
| Fuel oil | 3.658 | 786 | 883 | 543 | 323 | 242 | 167 | 167 |
| Coal | 827 | 1.093 | 629 | 43 | 47 | 36 | 28 | 23 |
| Wood | 7.524 | 10.668 | 13.218 | 14.325 | 15.709 | 20.164 | 21.142 | 23.049 |
| Electricity* | 1.384 | 1.710 | 2.205 | 3.380 | 3.757 | 3.944 | 4.405 | 4.436 |
| Domestic hot water | 32.636 | 33.040 | 32.897 | 31.127 | 29.089 | 27.837 | 28.420 | 28.748 |
| Liquefied petroleum gas | 1.073 | 1.205 | 3.208 | 3.121 | 1.787 | 1.049 | 1.577 | 1.293 |
| Natural gas | 15.256 | 17.163 | 16.615 | 17.242 | 17.100 | 17.191 | 17.489 | 18.148 |
| Gasoil | 5.535 | 3.478 | 2.501 | 1.966 | 1.877 | 1.797 | 1.720 | 1.647 |
| Fuel oil | 144 | 43 | 28 | 21 | 13 | 16 | 14 | 21 |
| Coal | 98 | 106 | 48 | 35 | 33 | 28 | 22 | 21 |
| Electricity | 10.530 | 11.045 | 10.497 | 8.742 | 8.279 | 7.757 | 7.599 | 7.619 |
| Cooking | 20.046 | 19.744 | 18.794 | 19.275 | 19.220 | 19.344 | 19.491 | 18.915 |
| Liquefied petroleum gas | 6.390 | 5.967 | 5.771 | 5.694 | 5.692 | 5.698 | 5.706 | 5.707 |
| Natural gas | 11.500 | 11.387 | 10.314 | 10.500 | 10.348 | 10.358 | 10.502 | 9.914 |
| Coal | 41 | 41 | 16 | 9 | 7 | 7 | 6 | 5 |
| Wood | 63 | 83 | 93 | 106 | 106 | 113 | 113 | 144 |
| Electricity | 2.052 | 2.266 | 2.600 | 2.965 | 3.067 | 3.169 | 3.164 | 3.145 |
| Lighting and other electrical appliances | 38.770 | 42.222 | 45.811 | 51.846 | 52.500 | 52.350 | 53.221 | 53.724 |
| Electricity | 38.770 | 42.222 | 45.811 | 51.846 | 52.500 | 52.350 | 53.221 | 53.724 |
* space cooling included
Source: Italian National Agency for New Technologies, Energy and Sustainable Economic Development (ENEA). "Rapporto Energia e Ambiente 2009-2010", 2012
Last updated: 02.09.2014
National Scientific Report Italy
Fundamentals and elements of the national residential building typology
Download:<IT_TABULA_ScientificReport_POLITO.pdf>
(in English Language)
Last updated: 31.10.2012
| Responsible for the content of this page: POLITO - Politecnico di Torino - Dipartimento Energia / Energy Department (contact information) |
