


- >
- Building Typology>
- COUNTRY PAGES>
- FR France
FR France - Country Page
National Contact Point
| Information in French language: | National Contact Point France (TABULA project) |
| National Contact Point France (EPISCOPE project) |
Residential Building Typology
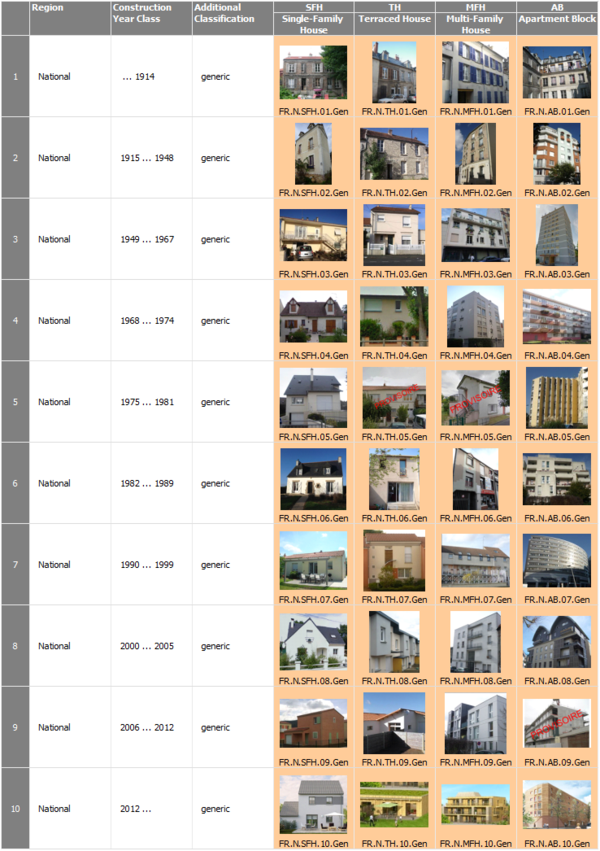
Building Type Matrix
classification scheme for residential buildings --- construction year classes --- pictures of example buildings
(►explanations)
Generic Building Types
Last updated: 02.09.2014
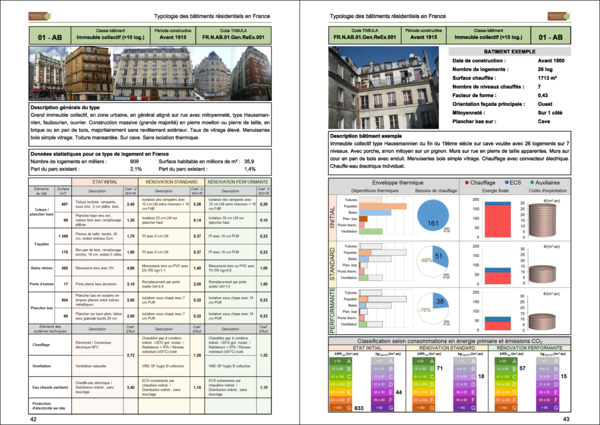
National Typology Brochure
example buildings --- typical energy consumption values --- effect of refurbishment measures --- building display sheets
(►explanations)
Brochure in French language. (Click on picture to download PDF.)
Last updated: 12.11.2015
Statistics of the French Building Stock
systematical overview --- available statistics for residential buildings and heat supply systems
(►explanations)
Overview
| Statistical Table | Item | Available | Sources |
| S-1.1 | Frequency of building types of the national building stock | yes | [1] |
| S-1.2.1 | Percentage of thermally refurbished envelope areas | yes | [2] |
| S-1.2.2 | Information on insulation level and window types | yes | [3] |
| S-2.1 | Centralisation of the heat supply (for space heating) | yes | [4] |
| S-2.2 | Heat distribution and storage of space heating systems | ||
| S-2.3 | Heat generation of space heating systems | yes | [5] |
| S-2.4 | Heat distribution and storage of domestic hot water systems | ||
| S-2.5 | Heat generation of domestic hot water systems | yes | [6] |
| S-2.6 | Solar thermal systems | yes | [7] |
| S-2.7 | Ventilation systems | yes | [8] |
| S-2.8 | Air-conditioning systems | yes | [9] |
| S-2.9 | Control of central heating systems | yes | [10] |
| S-3.1 | Domestic Energy consumption | yes | [11] |
Last updated: 04.09.2014
Data sources
[1] INSEE 1999_LOG1 - Logements par catégorie selon l'époque d'achèvement (France métropolitaine)
www.recensement-1999.insee.fr/default.asp
[2] ADEME: SOFRES (10000 ménages survey) + OPEN
[3] ADEME
[4] Données statistiques CEREN en 2013; tableau: parc des résidences principales en 2011,
selon la date de construction du logement et l’énergie de chauffage
http://www.ceren.fr/files/static/Publication_donnees_CEREN.xlsx
[5] données statistiques CEREN en 2013; titre du tableau: PARC DES RESIDENCES PRINCIPALES EN 2011,
SELON LA DATE DE CONSTRUCTION DU LOGEMENT ET L’ENERGIE DE CHAUFFAGE
http://www.ceren.fr/files/static/Publication_donnees_CEREN.xlsx
[6] CEREN
[7] Baromètre solaire thermique et héliothermodynamique Eurobserv'ER Mai 2013
(Systèmes solaires le journal des énergies renouvelables n° 215 2013)
www.enerplan.asso.fr/index.php
[8] ADEME: Air.h study n°2415117 for ADEME
[9] Etude du marché de la climatisation - Rapport d’étude et compléments EDF 2006
[10] ADEME: Ademe : technical conference on energy retrofit in dwellings
[11] Ceren Website: http://www.ceren.fr/files/static/Publication_donnees_CEREN.xlsx
This file is the basis for CEREN's publication called "DONNÉES STATISTIQUES DU CEREN",
published in June 2013
Last updated: 04.09.2014
Statistic S-1.1: Frequency of Building Types of the National Building Stock
| construction year class | SFH | TH | MFH | AB | sum | fraction | |
| number of buildings (1000) | |||||||
| 1 | < 1915 | 2 568 | 683 | 251 | 112 | 3 614 | 24 % |
| 2 | 1915…1948 | 1 445 | 384 | 141 | 83 | 2 053 | 14 % |
| 3 | 1949…1967 | 1 456 | 387 | 228 | 119 | 2 190 | 15 % |
| 4 | 1968…1974 | 1 188 | 316 | 110 | 105 | 1 719 | 12 % |
| 5 | 1975…1981 | 1 470 | 391 | 23 | 37 | 1 920 | 13 % |
| 6 | 1982…1989 | 1 452 | 386 | 27 | 21 | 1 887 | 13 % |
| 7 | 1990…1999 | 1 134 | 301 | 29 | 28 | 1 493 | 10 % |
| 8 | 2000…2005 | ||||||
| 9 | 2006…2012 | ||||||
| sum | 10 713 | 2 848 | 809 | 505 | 14 876 | 100 % | |
| fraction | 72 % | 19 % | 5 % | 3 % | 100 % | ||
Last updated: 08.11.2013
| construction year class | SFH | TH | MFH | AB | sum | fraction | |
|
number of dwellings (1000) |
|
||||||
|
1 |
< 1915 |
2 568 | 683 | 1 078 | 609 | 4 938 | 21% |
|
2 |
1915…1948 |
1 445 | 384 | 604 | 452 | 2 886 | 12% |
|
3 |
1949…1967 |
1 456 | 387 | 865 | 1 714 | 4 422 | 19% |
|
4 |
1968…1974 |
1 188 | 316 | 418 | 1 515 | 3 436 | 14% |
|
5 |
1975…1981 |
1 470 | 391 | 208 | 944 | 3 012 | 13% |
|
6 |
1982…1989 |
1 452 | 386 | 246 | 555 | 2 640 | 11% |
|
7 |
1990…1999 |
1 134 | 301 | 261 | 732 | 2 428 | 10% |
|
8 |
2000…2005 |
|
|||||
|
9 |
2006…2012 |
|
|||||
|
sum |
10 713 | 2 848 | 3 679 | 6 521 | 23 762 | 100% | |
|
fraction |
45% | 12% | 15% | 27% | 100% |
|
|
Last updated: 08.11.2013
| construction year class | SFH | TH | MFH | AB | sum | fraction | |
| living space (million m²) | |||||||
| 1 | < 1915 | 239 579 | 63 697 | 62 972 | 35 864 | 402 692 | 21% |
| 2 | 1915…1948 | 122 834 | 32 679 | 30 133 | 22 669 | 208 651 | 11% |
| 3 | 1949…1967 | 126 364 | 33 539 | 55 728 | 110 282 | 325 809 | 17% |
| 4 | 1968…1974 | 114 496 | 30 483 | 28 127 | 102 097 | 275 452 | 15% |
| 5 | 1975…1981 | 147 818 | 39 255 | 13 995 | 63 578 | 265 789 | 14% |
| 6 | 1982…1989 | 147 663 | 39 291 | 15 969 | 36 093 | 239 999 | 13% |
| 7 | 1990…1999 | 97 932 | 26 078 | 12 407 | 34 877 | 171 212 | 9% |
| 8 | 2000…2005 | ||||||
| 9 | 2006…2012 | ||||||
| sum | 996 686 | 265 023 | 219 330 | 405 460 | 1 889 604 | 100% | |
| fraction | 53% | 14% | 12% | 21% | 100% | ||
Source: INSEE 1999_LOG1 - Logements par catégorie selon l'époque d'achèvement (France métropolitaine)
www.recensement-1999.insee.fr/default.asp
Last updated: 08.11.2013
After 2000 period data:
| Frequency of building types of the national building stock (metropolitan France) | ||
| Building TYPE | Number of apartments | Living space in m² |
| 2001… 2005 | 1740630 | 189212316 |
| 2006… 2011 | 2140178 | 157247145 |
Last updated: 08.11.2013
Aggregation for Building Stock Model
| construction period | number of Buildings (x1000) |
number of Apartments (x1000) |
living space (106 m²) |
||
| "Single Family Houses" |
SFH I | until 1975 | 8207.5 | 8207.5 | 743.8 |
| SFH II | 1976 - 2000 | 5308.6 | 5308.6 | 512.4 | |
| "Multi Family Houses " |
MFH I | until 1975 | 1178.5 | 7023.4 | 433.7 |
| MFH II | 1975 - 2000 | 222.0 | 2986.3 | 176.5 |
Statistic S-1.2.1: Percentage of thermally refurbished envelope areas
| percentages related to building numbers of the respective classes SFH I - MFH II | ||||
| Percentage of modernised element area (with improved thermal protection) |
||||
| Building classes | SFH I | SFH II | MFH I | MFH II |
| until 1975 | 1975-2000 | until 1975 | 1975-2000 | |
| walls |
37
|
88
|
19
|
52
|
| roofs / upper floor ceilings |
62
|
90
|
25
|
65
|
| basement / cellar ceiling |
12
|
42
|
10
|
30
|
| windows* |
35
|
75
|
23
|
57
|
Statistic S-1.2.2: Information on insulation level and window types
S-1.2.2.1: Insulation thicknesses of refurbished Elements
|
numbers related to modernised elements
|
|
|
Average values of insulation Resistance (R K.m2/W)
|
|
|
walls
|
2 m2.K/W
|
|
roofs / upper floor ceilings
|
2.5-3 m2.K/W
|
|
basement / cellar ceiling
|
2 m2.K/W
|
|
Double glazing windows
|
2 – 2.3 W/m2.K
|
Statistic S-2.1: Centralisation of the Heat Supply (for Space Heating)
| SFH I | SFH II | MFH I | MFH II | |
| ( - 1975) | (1975 - 2011) | ( - 1975) | (1975 - 2011) | |
| Centralisation of Heating System | 95% | 94% | 42% | 17% |
| District Heating | - | - | 9% | 7% |
| Building / Apartment Heating Systems | - | - | 47% | 76% |
| Room Heating Systems | 5% | 6% | 2% | 1% |
Source: données statistiques CEREN en 2013; tableau: parc des résidences principales en 2011, selon la date de construction du logement et l’énergie de chauffage
www.ceren.fr/files/static/Publication_donnees_CEREN.xlsx
Last updated: 08.11.2013
Statistic S-2.3: Heat Generation of Space Heating Systems
Heat Generator Types
Percentages related to: dwellings in all residential buildings of the classes SFH I – MFH II
| Heat Generators for Space Heating | SFH I | SFH II | MFH I | MFH II | |
| District Heating | 9,3% | 6,9% | |||
| Collective Boilers | Gas | 35,8% | 14,0% | ||
| Oil | 5,7% | 1,9% | |||
| Biomass | 0,8% | 0,7% | |||
| Coal | 0,1% | 0,0% | |||
| Boilers (individual) | Gas | 2,7% | 1,3% | 27,1% | 27,6% |
| Oil | 45,5% | 17,3% | 0,5% | 0,1% | |
| Biomass | 2,7% | 1,3% | 0,1% | 0,1% | |
| Coal | 0,2% | 0,0% | 0,0% | 0,0% | |
| LPG | 3,3% | 3,9% | 0,0% | 0,2% | |
| Electricity | 37,2% | 66,9% | 19,2% | 47,7% | |
| Others | 0,4% | 0,5% | |||
| Room Heating Systems / Stoves |
Gas | 0,5% | 0,0% | 0,3% | 0,1% |
| Oil | 0,1% | 0,1% | 0,1% | 0,0% | |
| Biomass | 6,0% | 7,1% | 0,5% | 0,2% | |
| Coal | 0,9% | 0,0% | 0,1% | 0,0% | |
| LPG | 0,5% | 0,1% | 0,2% | 0,0% | |
| Electricity | 0,0% | 1,6% | 0,3% | 0,3% | |
| TOTAL | 100,0% | 100,0% | 100,0% | 100,0% | |
Last updated: 08.11.2013
Energy Career
Percentages related to: space heating all residential buildings of the classes SFH I - MFH II
| Summary: Energy Carriers | SFH I | SFH II | MFH I | MFH II |
| District Heating | 0% | 0% | 9% | 7% |
| Gas | 39% | 28% | 63% | 42% |
| LPG | 2% | 3% | 0% | 0% |
| Oil | 29% | 13% | 6% | 2% |
| Biomass | 6% | 6% | 0% | 0% |
| Coal | 1% | 0% | 0% | 0% |
| Electricity | 23% | 50% | 20% | 48% |
| Others | 0,2% | 0,4% | 0,8% | 0,9% |
| 100,00% | 100,00% | 100,00% | 100,00% |
Source : données statistiques CEREN en 2013; titre du tableau: PARC DES RESIDENCES PRINCIPALES EN 2011, SELON LA DATE DE CONSTRUCTION DU LOGEMENT ET L’ENERGIE DE CHAUFFAGE
www.ceren.fr/files/static/Publication_donnees_CEREN.xlsx
Last updated: 08.11.2013
After 2000-period
Heat Generator Types
| Heat Generators for Space Heating |
SFH | MFH | |||
| 2001…2005 | 2006…2011 | 2001…2005 | 2006…2011 | ||
| Collective boilers | Urban heating-others | - | - | 4% | 4% |
| Coal | - | - | 0% | 0% | |
| Oil | - | - | 1% | 0% | |
| Gas | - | - | 8% | 8% | |
| Boilers (individual) | Urban heating-others | 0% | 1% | 0% | 0% |
| Coal | 0% | 0% | 0% | 0% | |
| Oil | 13% | 3% | 0% | 0% | |
| Gas | 36% | 28% | 36% | 33% | |
| LPG | 4% | 1% | 2% | 0% | |
| Electricity | 40% | 64% | 47% | 54% | |
| Biomass | 0% | 0% | 0% | 0% | |
| Room Heating systems | Coal | 0% | 0% | 0% | 0% |
| Oil | 0% | 0% | 0% | 0% | |
| Gas | 0% | 0% | 0% | 0% | |
| LPG | 0% | 0% | 0% | 0% | |
| Electricity | 2% | 1% | 1% | 1% | |
| Biomass | 4% | 1% | 0% | 0% | |
| TOTAL | 100% | 100% | 100% | 100% | |
Last updated: 08.11.2013
Energy Carriers
Percentages related to: space heating all residential buildings of the classes defined below
| Summary: Energy Carriers | 2001…2005 | 2006…2012 | 2001…2005 | 2006…2012 |
| SFH | SFH | MFH | MFH | |
| District Heating | 0% | 1% | 4% | 4% |
| Gas | 36% | 28% | 45% | 41% |
| GPL | 4% | 1% | 2% | 0% |
| Oil | 14% | 3% | 2% | 0% |
| Biomass | 4% | 1% | 0% | 0% |
| Coal | 0% | 0% | 0% | 0% |
| Electricity | 42% | 65% | 47% | 55% |
| TOTAL | 100% | 100% | 100% | 100% |
Last updated: 08.11.2013
Statistic S-2.5: Heat generation of domestic hot water systems
|
Percentages related to number of dwellings in buildings of classes SFH I- MFH II
|
||||
|
Heat Generation for hot water supply
|
||||
|
|
SFH I
|
SFH II
|
MFH I
|
MFH II
|
|
hot water generation combined with heating system
|
27.8%
|
18.9%
|
39.3%
|
25.1%
|
|
electric heaters with small storage tanks
|
27.1%
|
36.4%
|
19.6%
|
30.9%
|
|
gas flow heaters without storage tanks
|
7.7%
|
4.2%
|
8.9%
|
6.3%
|
|
total ECS indépendante
|
34.8%
|
40.5%
|
32.0%
|
37.7%
|
|
hot water storage tanks directly heated with fuels (e.g. gas)
|
0.0%
|
0.0%
|
3.4%
|
0.5%
|
|
heat pump for hot water generation (exhaust air, cellar air)
|
0.0%
|
0.0%
|
0.0%
|
0.0%
|
|
No hot water production
|
2.6%
|
0.0%
|
0.1%
|
0.0%
|
Statistic S-2.6: Solar Thermal Systems
Number of solar systems
| SFH | MFH | SFH and MFH in 2011 | SFH and MFH in 2012 | |
|
installed m² |
1 158 848 | 370 682 | 2 204 052 | 2 396 313 |
|
production capactiy |
279 972 | 8 727 | 1542,8 | 1677,4 |
Source: Baromètre solaire thermique et héliothermodynamique Eurobserv'ER Mai 2013 (Systèmes solaires le journal des énergies renouvelables n° 215 2013)
www.enerplan.asso.fr/index.php
Last updated: 08.11.2013
Statistic S-2.7: Ventilation systems
Percentage of ventilation systems
| SFH I | SFH II | MFH I | MFH II | |
| No ventilation | 14 % | 9 % | ||
| Room natural ventilation | 36 % | 34 % | ||
| Natural ventilation by duct | 22 % | 16 % | ||
| Natural ventilation with assistance | - | 1 % | ||
| local mechanical ventilation | 1 % | 0 % | ||
| mechanical ventilation on ducts | - | 13 % | ||
| Self controlled mech ventilation | 23 % | 22 % | ||
| Hygro controlled mech ventilation | 5 % | 5 % | ||
| Double flow mech ventilation | 1 % | 0 % | ||
Statistic S-2.8: Air-conditioning systems
number of air conditioning systems in dwellings
| SFH I | SFH II | MFH I | MFH II | |
| number of dwellings (x 1000) | 412.9 | 355.1 | 116.5 | 100.1 |
Statistic S-2.9: Control of Central Heating Systems
% of dwellings equipped
| SFH I | SFH II | MFH I | MFH II | |
| Thermostat | 43 | 47 | 46 | 70 |
| Thermostatic valve | 39 | 43 | 23 | 29 |
| Programming device | 13 | 16 | 10 | 13 |
Statistic S-3.1: Domestic energy consumption
| Energy consumption for all energies and all uses (TWh) | ||||||||
| Types of building | Construction period | Number of dwellings (in thousands) | Floor area in million of m² | Total | including gas | including electricity | including fuel | others |
| Collective buildings | Before 1975 | 7.189 | 476 | 96,2 | 50,4 | 24,9 | 6,6 | 14,3 |
| 1975-1998 | 3.308 | 217 | 35,4 | 13,1 | 16 | 1,5 | 4,9 | |
| 1999 and after | 1.667 | 109 | 15,8 | 6,1 | 8,4 | 0,2 | 1 | |
| TOTAL | 12.164 | 802 | 147,4 | 69,6 | 49,3 | 8,3 | 20,2 | |
| Individual houses | Before 1975 | 8.254 | 890 | 181,1 | 54,3 | 46,2 | 40,5 | 40,2 |
| 1975-1998 | 5.013 | 577 | 98,8 | 18,9 | 38 | 13 | 28,9 | |
| 1999 and after | 2.528 | 292 | 47,6 | 11,4 | 20,2 | 2,8 | 13,2 | |
| TOTAL | 15.795 | 1.759 | 327,6 | 84,6 | 104,4 | 56,3 | 82,3 | |
Downloaded from CEREN website, with following link:
www.ceren.fr/files/static/Publication_donnees_CEREN.xlsx
This file is the basis for CEREN's publication called "DONNÉES STATISTIQUES DU CEREN", published in June 2013
Last updated: 04.09.2014
|
Responsible for the content of this page: |
