


- >
- Building Typology>
- COUNTRY PAGES>
- DE Germany
DE Germany - Country Page
National Contact Point
| Information in German language: | National Contact Point Germany (EPISCOPE) |
| TABULA Building Typology Germany |
Residential Building Typology
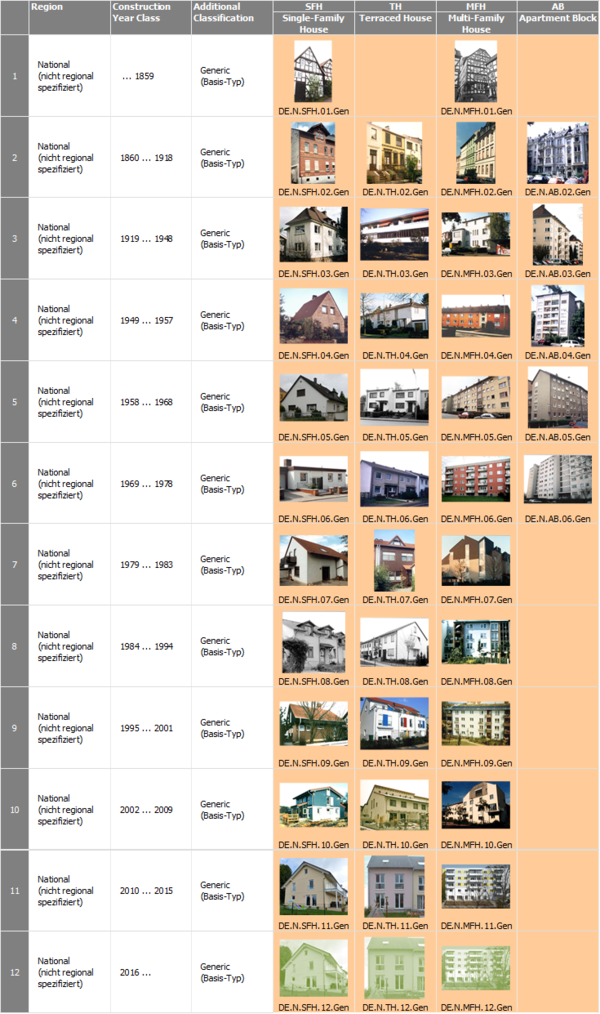
Building Type Matrix
classification scheme for residential buildings --- construction year classes --- pictures of example buildings
(►explanations)
Generic Building Types
Last updated: 10.04.2015
Further Building Types
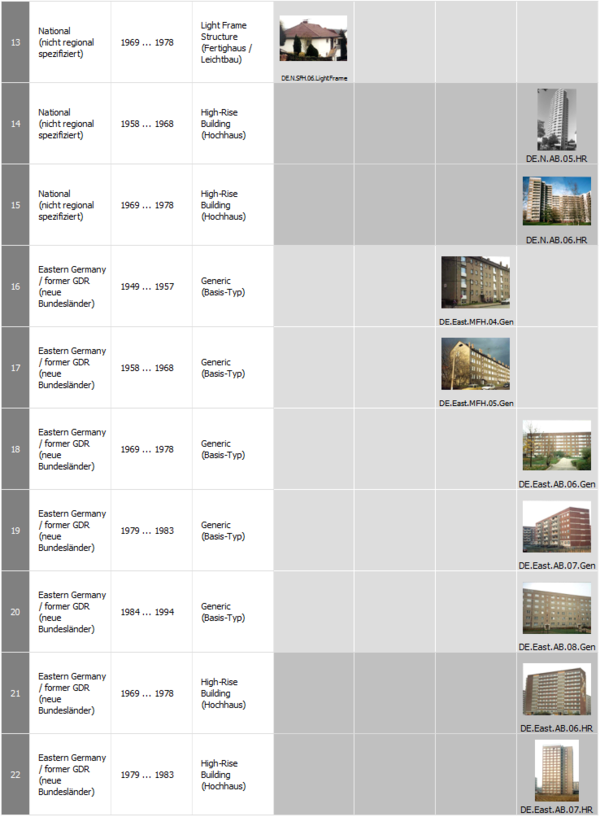
Last updated: 04.09.2014
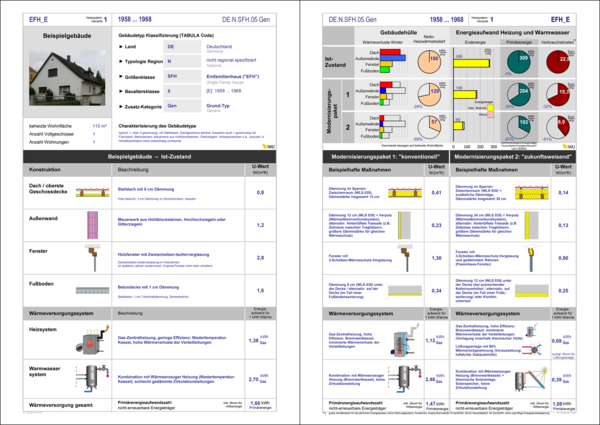
National Typology Brochure
example buildings --- typical energy consumption values --- effect of refurbishment measures --- building display sheets
(►explanations)
Brochure in German language. (Click on picture to download PDF.)
Last updated: 10.04.2015
Statistics of the German Building Stock
systematical overview --- available statistics for residential buildings and heat supply systems
(►explanations)
Overview
| Statistical Table | Item | Available | Sources |
| S-1.1 | Frequency of building types of the national building stock | yes | [2] |
| S-1.2.1 | Percentage of thermally refurbished envelope areas | yes | [1] |
| S-1.2.2 | Information on insulation level and window types | yes | [1] |
| S-2.1 | Centralisation of the heat supply (for space heating) | yes | [1] |
| S-2.2 | Heat distribution and storage of space heating systems | yes | [1] |
| S-2.3 | Heat generation of space heating systems | yes | [1] |
| S-2.4 | Heat distribution and storage of domestic hot water systems | yes | [1] |
| S-2.5 | Heat generation of domestic hot water systems | yes | [1] |
| S-2.6 | Solar thermal systems | ||
| S-2.7 | Ventilation systems | ||
| S-2.8 | Air-conditioning systems | ||
| S-2.9 | Control of central heating systems | ||
| S-3.1 | Domestic energy consumption | yes | [3],[4] |
[1] Source: Analysis carried out by IWU 2011 for the TABULA project with "Datenbasis Gebäudebestand", a data base of a representative survey of the German residential housing stock (project report: "Datenbasis Gebäudebestand", Institut Wohnen und Umwelt, 9.12.2010)
[2] Source: "Basisdaten für Hochrechnungen mit der Deutschen Gebäudetypologie des IWU", Institut Wohnen und Umwelt, Darmstadt, October 2013. In this paper data from the German census 2011 was analysed. For assigning the building typology's size classes (SFH, TH, MFH, AB) to the statistical data the following definitions were used: SFH: detached buildings with 1-2 apartments, TH: other types of buildings with 1-2 apartments (terraced houses, double houses, others) , MFH: buildings with 3-12 apartments, AB: buildings with 13 or more apartments.
[3] Source: AG Energiebilanzen, BMWi (2014): Zahlen und Fakten Energiedaten. Nationale und Internationale Entwicklungen. 23.06.2014, Table 7a
[4] Source: Statistisches Bundesamt (2014): Gebäude und Wohnungen. Bestand an Wohnungen und Wohngebäuden. Bauabgang von Wohnungen und Wohngebäuden. Lange Reihen ab 1969-2012, Tables 1.1 and 2.1 www.destatis.de/DE/Publikationen/Thematisch/Bauen/Wohnsituation/FortschreibungWohnungsbestandXLS_5312301.html
Last updated: 02.09.2014
Statistic S-1.1: Frequency of building types of the national building stock
(building stock in May 2011: residential buildings erected until end of 2009)
total residential building stock in May 2011: 18,368,000 buildings, 39,432,000 apartments, 3,575 million m² living space
| construction | SFH | TH | MFH | AB | sum | fraction | |
| year class | number of buildings (1000) | ||||||
| 1 | ... 1859 | 330 | 148 | 54 | 0.6 | 533 | 3 % |
| 2 | 1860 ... 1918 | 966 | 492 | 442 | 28.7 | 1929 | 11 % |
| 3 | 1919 ... 1948 | 1131 | 710 | 388 | 7.4 | 2236 | 12 % |
| 4 | 1949 ... 1957 | 859 | 447 | 356 | 17.3 | 1679 | 9 % |
| 5 | 1958 ... 1968 | 1509 | 633 | 586 | 34.0 | 2762 | 15 % |
| 6 | 1969 ... 1978 | 1507 | 611 | 412 | 50.1 | 2580 | 14 % |
| 7 | 1979 ... 1983 | 704 | 335 | 146 | 15.0 | 1200 | 7 % |
| 8 | 1984 ... 1994 | 1160 | 652 | 309 | 28.7 | 2150 | 12 % |
| 9 | 1995 ... 2001 | 1035 | 619 | 244 | 20.9 | 1919 | 11 % |
| 10 | 2002 ... 2009 | 775 | 384 | 85 | 7.6 | 1251 | 7 % |
| sum | 9976 | 5030 | 3023 | 210 | 18239 | 100 % | |
| fraction | 55 % | 28 % | 17 % | 1 % | 100 % | ||
Last updated: 31.10.2013
| construction | SFH | TH | MFH | AB | sum | fraction | |
| year class | number of dwellings (1000) | ||||||
| 1 | ... 1859 | 399 | 181 | 214 | 11.1 | 806 | 2 % |
| 2 | 1860 ... 1918 | 1213 | 617 | 2177 | 525.8 | 4533 | 12 % |
| 3 | 1919 ... 1948 | 1389 | 840 | 1911 | 126.0 | 4265 | 11 % |
| 4 | 1949 ... 1957 | 1060 | 546 | 2003 | 307.5 | 3915 | 10 % |
| 5 | 1958 ... 1968 | 1948 | 749 | 3348 | 817.7 | 6863 | 17 % |
| 6 | 1969 ... 1978 | 1915 | 685 | 2313 | 1366.3 | 6279 | 16 % |
| 7 | 1979 ... 1983 | 881 | 374 | 852 | 355.7 | 2463 | 6 % |
| 8 | 1984 ... 1994 | 1397 | 722 | 1826 | 605.3 | 4550 | 12 % |
| 9 | 1995 ... 2001 | 1204 | 674 | 1390 | 407.7 | 3675 | 9 % |
| 10 | 2002 ... 2009 | 858 | 409 | 461 | 151.4 | 1880 | 5 % |
| sum | 12263 | 5796 | 16495 | 4674 | 39228 | 100 % | |
| fraction | 31 % | 15 % | 42 % | 12 % | 100 % | ||
Last updated: 31.10.2013
| construction | SFH | TH | MFH | AB | sum | fraction | |
| year class | living space (million m²) | ||||||
| 1 | ... 1859 | 46 | 19 | 16 | 0.7 | 82 | 2 % |
| 2 | 1860 ... 1918 | 135 | 62 | 163 | 35.8 | 396 | 11 % |
| 3 | 1919 ... 1948 | 150 | 82 | 129 | 7.9 | 370 | 10 % |
| 4 | 1949 ... 1957 | 116 | 52 | 125 | 17.0 | 309 | 9 % |
| 5 | 1958 ... 1968 | 218 | 76 | 225 | 47.1 | 567 | 16 % |
| 6 | 1969 ... 1978 | 233 | 79 | 169 | 86.7 | 569 | 16 % |
| 7 | 1979 ... 1983 | 110 | 45 | 64 | 21.9 | 240 | 7 % |
| 8 | 1984 ... 1994 | 178 | 85 | 133 | 34.8 | 431 | 12 % |
| 9 | 1995 ... 2001 | 158 | 80 | 104 | 25.5 | 368 | 10 % |
| 10 | 2002 ... 2009 | 119 | 52 | 39 | 10.4 | 220 | 6 % |
| sum | 1463 | 633 | 1168 | 288 | 3552 | 100 % | |
| fraction | 41 % | 18 % | 33 % | 8 % | 100 % | ||
Last updated: 31.10.2013
| construction | SFH | TH | MFH | AB | sum | fraction | |
| year class | TABULA reference area (million m²) | ||||||
| 1 | ... 1859 | 50 | 21 | 18 | 1 | 90 | 2 % |
| 2 | 1860 ... 1918 | 148 | 69 | 180 | 39 | 436 | 11 % |
| 3 | 1919 ... 1948 | 165 | 91 | 142 | 9 | 407 | 10 % |
| 4 | 1949 ... 1957 | 127 | 57 | 137 | 19 | 340 | 9 % |
| 5 | 1958 ... 1968 | 240 | 84 | 248 | 52 | 623 | 16 % |
| 6 | 1969 ... 1978 | 257 | 87 | 186 | 95 | 626 | 16 % |
| 7 | 1979 ... 1983 | 121 | 49 | 70 | 24 | 264 | 7 % |
| 8 | 1984 ... 1994 | 196 | 94 | 146 | 38 | 474 | 12 % |
| 9 | 1995 ... 2001 | 173 | 89 | 115 | 28 | 405 | 10 % |
| 10 | 2002 ... 2009 | 131 | 57 | 43 | 11 | 242 | 6 % |
| sum | 1609 | 697 | 1285 | 316 | 3908 | 100 % | |
| fraction | 41 % | 18 % | 33 % | 8 % | 100 % | ||
*calculation approach: TABULA reference area = living space x 1.1
Last updated: 31.10.2013
Aggregation for Building Stock Model
|
construction |
number of buildings |
number of dwellings |
living space | Tabula reference area |
||
| 1000 | 1000 | million m² | million m² | |||
| "Single Family Houses" | SFH I | until 1978 | 9342 | 11541 | 1270 | 1396 |
| (<= 2 dwellings) | SFH II | 1979 - 1994 | 2852 | 3373 | 418 | 459 |
| SFH II | 1995 - 2009 | 2813 | 3144 | 409 | 450 | |
| "Multi Family Houses " | MFH I | until 1978 | 2377 | 15120 | 1024 | 1126 |
| (>=3 dwellings) | MFH II | 1979 - 1994 | 498 | 3639 | 253 | 278 |
| MFH III | 1995 - 2009 | 358 | 2411 | 179 | 197 | |
| sum | 18239 | 39228 | 3552 | 3908 |
Last updated: 31.10.2013
Statistic S-1.2.1: Percentage of Thermally Refurbished Envelope Areas
| Percentages related to building numbers of the respective classes SFH I - MFH II | ||||
| Percentage of modernised element area (with improved thermal protection) | ||||
| Building classes | SFH I | SFH II | MFH I | MFH II |
| until 1978 | 1979-1994 | until 1978 | 1979-1994 | |
| walls | 20 % | 7 % | 26 % | 15 % |
| roofs / upper floor ceilings | 47 % | 24 % | 48 % | 23 % |
| basement / cellar ceiling | 10 % | 3 % | 11 % | 7 % |
| windows* | 35 % | 12 % | 44 % | 24 % |
modernisation of buildings erected after 1995 (SFH III and MFH III) neglected
*percentage of thermal protection glasing (window installation after 1995)
Statistic S-1.2.2: Information on Insulation Level and Window Types
S-1.2.2.1: Insulation thicknesses of refurbished Elements
| Numbers related to modernised elements | |
| Average values of insulation layer thickness | |
| walls | 8.7 cm |
| roofs / upper floor ceilings | 12.8 cm |
| basement / cellar ceiling | 7.5 cm |
Statistic S-2.1: Centralisation of the Heat Supply (for Space Heating)
| percentages related to: numbers of dwellings in all residential buildings of the classes SFH I - MFH III | ||||||
| SFH | MFH | |||||
| SFH I (-1978) |
SFH II (1979-94) |
SFH III (1995-2009) |
MFH I (-1978) |
MFH II (1979-94) |
MFH III (1995-2009 ) |
|
| Centralisation of Heating System | ||||||
| District Heating | 1.4 % | 2.3 % | 3.6 % | 12.0 % | 22.2 % | 11.6 % |
| Building / Apartment Heating Systems | 88.4 % | 93.4 % | 94.1 % | 81.9 % | 75.1 % | 88.0 % |
| Room Heating Systems | 10.2 % | 4.3 % | 2.3 % | 6.1 % | 2.7 % | 0.4 % |
Statistic S-2.2: Heat Distribution and Storage of Space Heating Systems
| percentages related to number of dwellings in buildings of classes SFH I- MFH III | ||||||
| which are supplied by building / apartment or district heating systems | ||||||
| Heat distribution and storage for space heating | ||||||
| SFH I | SFH II | SFH III | MFH I | MFH II | MFH III | |
| level 1: "high heat losses" | 31 % | 0 % | 0 % | 39 % | 0 % | 0 % |
| level 2: "medium heat losses" | 28 % | 61 % | 30 % | 33 % | 85 % | 74 % |
| level 3: "low heat losses" | 13 % | 8 % | 23 % | 19 % | 9 % | 22 % |
| level 4: "no heat losses" | 29 % | 31 % | 48 % | 9 % | 5 % | 4 % |
Statistic S-2.3: Heat Generation of Space Heating Systems
Heat Generator Types
| percentages related to: dwellings in all residential buildings of the classes SFH I - MFH III | |||||||
| Heat Generators for Space Heating | SFH | MFH | |||||
| SFH I | SFH II | SFH III | MFH I | MFH II | MFH III | ||
| Heat Generators | Energy Carrier | ||||||
| District Heating | |||||||
| District Heating | 1.4 % | 2.3 % | 3.6 % | 12.0 % | 22.2 % | 11.6 % | |
| Building / Apartment Heating Systems | |||||||
| Boilers | Gas | 43.6 % | 48.1 % | 66.4 % | 52.5 % | 61.9 % | 77.9 % |
| Oil | 39.4 % | 40.6 % | 18.7 % | 25.6 % | 12.7 % | 5.2 % | |
| Biomass | 4.1 % | 3.0 % | 2.9 % | 2.3 % | 0.5 % | 3.2 % | |
| Coal | 0.3 % | 0.0 % | 0.0 % | 0.1 % | 0.0 % | 0.0 % | |
| Heat Pump | Electricity | 1.0 % | 1.7 % | 6.1 % | 1.3 % | 0.0 % | 1.4 % |
| Gas | 0.0 % | 0.0 % | 0.0 % | 0.0 % | 0.0 % | 0.0 % | |
| CHP Enginge | Gas | 0.0 % | 0.0 % | 0.0 % | 0.1 % | 0.0 % | 0.3 % |
| direct electric | Electricity | 0.0 % | 0.0 % | 0.0 % | 0.0 % | 0.0 % | 0.0 % |
| Room Heating Systems | |||||||
| Stoves | Gas | 1.4 % | 0.0 % | 0.0 % | 1.2 % | 0.1 % | 0.0 % |
| Oil | 1.4 % | 0.3 % | 0.2 % | 0.9 % | 0.1 % | 0.0 % | |
| Biomass | 3.8 % | 0.3 % | 0.8 % | 1.3 % | 0.0 % | 0.0 % | |
| Coal | 0.7 % | 0.0 % | 0.0 % | 0.6 % | 0.0 % | 0.0 % | |
| direct electric | Electricity | 2.9 % | 3.7 % | 1.3 % | 2.1 % | 2.5 % | 0.4 % |
Energy Carriers
| percentages related to: dwellings in all residential buildings of the classes SFH I - MFH III |
SFH | MFH | ||||
| SFH I | SFH II | SFH III | MFH I | MFH II | MFH III | |
| Summary: Energy Carriers | ||||||
| District Heating | 1.4 % | 2.3 % | 3.6 % | 12.0 % | 22.2 % | 11.6 % |
| Gas | 45.0 % | 48.1 % | 66.4 % | 53.8 % | 62.0 % | 78.2 % |
| Oil | 40.8 % | 40.9 % | 18.9 % | 26.5 % | 12.8 % | 5.2 % |
| Biomass | 7.9 % | 3.3 % | 3.7 % | 3.6 % | 0.5 % | 3.2 % |
| Coal | 1.0 % | 0.0 % | 0.0 % | 0.7 % | 0.0 % | 0.0 % |
| Electricity | 3.9% | 5.4 % | 7.4 % | 3.4 % | 2.5 % | 1.8 % |
Statistic S-2.4: Heat Distribution and Storage of Domestic Hot Water Systems
| percentages related to number of dwellings in buildings of classes SFH I- MFH III | ||||||
| only buildings where the hot water is provided by the main heat generator for space heating are considered | ||||||
| Heat distribution and storage for space heating | ||||||
| SFH I | SFH II | SFH III | MFH I | MFH II | MFH III | |
| level 1: installed until 1979, not modernised | 42 % | 0 % | 0 % | 37 % | 0 % | 0 % |
| level 2: installed or modernised 1980 - 2000 | 39 % | 89 % | 55 % | 43 % | 86 % | 77 % |
| level 3: installed or modernised since 2001 | 19 % | 11 % | 45 % | 21 % | 14 % | 23 % |
Statistic S-2.5: Heat Generation of Domestic Hot Water Systems
| percentages related to number of dwellings in buildings of classes SFH I- MFH III | ||||||
| Heat Generation for hot water supply | ||||||
| SFH I | SFH II | SFH III | MFH I | MFH II | MFH III | |
| hot water generation combined with heating system | 74 % | 86 % | 91 % | 67 % | 69 % | 86 % |
| electric flow heaters without storage tanks | 13 % | 5 % | 5 % | 23 % | 28 % | 13 % |
| electric heaters with small storage tanks | 6 % | 4 % | 1 % | 3 % | 1 % | 1 % |
| gas flow heaters without storage tanks | 3 % | 0 % | 0 % | 6 % | 1 % | 1 % |
| hot water storage tanks directly heated with fuels (e.g. gas) | 4 % | 5 % | 2 % | 1 % | 1 % | 0 % |
| heat pump for hot water generation (exhaust air, cellar air) | 0 % | 0 % | 1 % | 0 % | 0 % | 0 % |
Statistic S-3.1: Domestic energy consumption
Final energy consumption of private households by application in Germany, in TWh
| 1996 | 2008 | 2009 | 2010 | 2011 | 2012 | |
| Total | 836.9 | 710.6 | 688.3 | 743.2 | 648.2 | 675.4 |
| Space Heating | 657.8 | 509.0 | 489.3 | 549.4 | 433.1 | 462.3 |
| Oil | 239.3 | 155.5 | 136.5 | 139.0 | 109.0 | 117.2 |
| Oil inventories | 9.0 | |||||
| Gas | 285.8 | 222.6 | 215.6 | 243.3 | 189.5 | 201.8 |
| Electricity | 26.9 | 16.8 | 15.4 | 18.8 | 9.2 | 8.8 |
| District heating | 43.1 | 42.0 | 44.9 | 49.3 | 40.4 | 42.9 |
| Coal | 28.5 | 11.4 | 10.5 | 14.9 | 16.1 | 14.2 |
| Renewables | 60.8 | 66.4 | 84.1 | 69.0 | 77.5 | |
| Other | 25.2 | |||||
| Domestic Hot Water | 89.6 | 94.4 | 93.4 | 90.1 | 105.9 | 102.9 |
| Oil | 24.4 | 24.1 | 18.5 | 17.3 | 22.5 | 22.3 |
| Gas | 34.2 | 45.5 | 48.6 | 45.7 | 50.9 | 49.1 |
| Electricity | 22.8 | 17.2 | 18.9 | 20.0 | 19.3 | 19.0 |
| District heating | 5.7 | 3.6 | 4.1 | 3.3 | 5.2 | 5.1 |
| Coal | 0.8 | 1.1 | 0.0 | 0.0 | 0.0 | 0.4 |
| Renewables | 2.9 | 3.2 | 3.8 | 8.0 | 6.9 | |
| Other | 1.6 | |||||
| Other Process Heat Applications | 27.7 | 39.1 | 38.8 | 38.1 | 39.5 | 40.2 |
| Gas | 3.3 | 0.9 | 0.7 | 0.7 | 1.0 | 1.0 |
| Electricity | 22.8 | 38.1 | 38.0 | 37.4 | 38.5 | 39.2 |
| Other | 1.6 | |||||
| Cooling | ||||||
| Other Process Cooling (Electricity) | 27.8 | 27.6 | 27.1 | 29.0 | 29.2 | |
| Mechanical Energy | 50.5 | 4.0 | 3.3 | 3.3 | 3.4 | 3.4 |
| Oil | 0.7 | 0.0 | 0.0 | 0.0 | 0.0 | |
| Electricity | 50.5 | 3.3 | 3.3 | 3.3 | 3.4 | 3.4 |
| ICT (Electricity) | 24.1 | 23.8 | 23.4 | 24.6 | 24.7 | |
| Lighting (Electricity) | 11.4 | 12.2 | 12.1 | 11.8 | 12.7 | 12.7 |
Data Source: AG Energiebilanzen, BMWi (2014): Zahlen und Fakten Energiedaten. Nationale und Internationale Entwicklungen. 23.06.2014, Table 7a
Additional data
| 1996 | 2008 | 2009 | 2010 | 2011 | 2012 | |
| Dwellings in residential and non-residential buildings | ||||||
| Living area [1000 m²] | 3,054,302 | 3,462,334 | 3,462,334 | 3,723,050 | 3,741,851 | 3,763,379 |
| Number of dwellings | 36,492,323 | 40,057,282 | 40,057,282 | 41,223,250 | 41,373,770 | 41,550,267 |
| Dwelling in residential buildings | ||||||
| Living area [1000 m²] | 2,992,485 | 3,393,400 | 3,409,819 | 3,597,985 | 3,616,552 | 3,637,799 |
| Number of dwellings | 35,789,160 | 39,267,887 | 39,390,468 | 3,9815,920 | 39,963,739 | 40,136,317 |
| Number of buildings | 15,924,303 | 17,949,803 | 18,029,257 | 18,359,032 | 18,447,707 | 18,545,526 |
Data source: Statistisches Bundesamt (2014): Gebäude und Wohnungen. Bestand an Wohnungen und Wohngebäuden. Bauabgang von Wohnungen und Wohngebäuden. Lange Reihen ab 1969-2012, Tables 1.1 and 2.1
Last updated: 02.09.2014
National Scientific Report Germany
Fundamentals and elements of the national residential building typology
Download:<DE_TABULA_ScientificReport_IWU.pdf>
(in English Language)
Last updated: 02.11.2012
| Responsible for the content of this page: IWU - Institute for Housing and Environment (contact information) |
