


- >
- Building Typology>
- COUNTRY PAGES>
- CZ Czech Republic
CZ Czech Republic - Country Page
National Contact Point
| Information in Czech language: | National Contact Point Czech Republic (EPISCOPE) |
| TABULA Building Typology Czech Republic |
Residential Building Typology
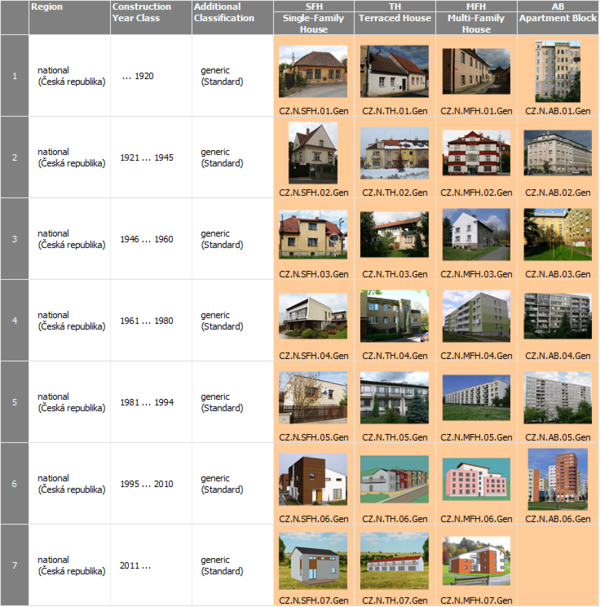
Building Type Matrix
classification scheme for residential buildings --- construction year classes --- pictures of example buildings
(►explanations)
Generic Building Types
Last updated: 13.02.2015
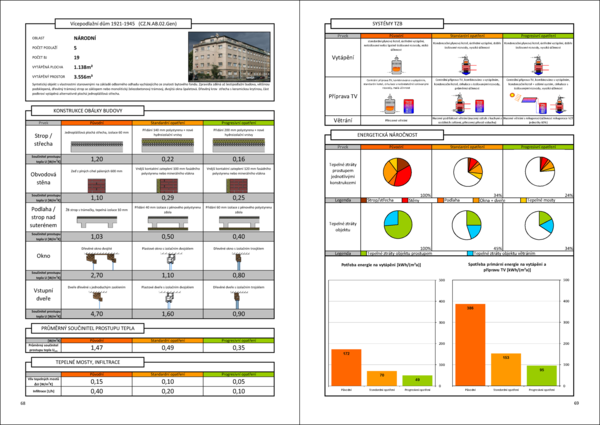
National Typology Brochure
example buildings --- typical energy consumption values --- effect of refurbishment measures --- building display sheets
(►explanations)
Brochure in Czech language. (Click on picture to download PDF.)
Last updated: 03.03.2015
Statistics of the Czech Building Stock
systematical overview --- available statistics for residential buildings and heat supply systems
(►explanations)
Overview
| Statistical Table | Item | Available | Sources |
| S-1.1 | Frequency of building types of the national building stock | yes | [1] |
| S-1.2.1 | Percentage of thermally refurbished envelope areas | yes | [2] |
| S-1.2.2 | Information on insulation level and window types | yes | [3] |
| S-2.1 | Centralisation of the heat supply (for space heating) | yes | [3], [4] |
| S-2.2 | Heat distribution and storage of space heating systems | ||
| S-2.3 | Heat generation of space heating systems | yes | [5] |
| S-2.4 | Heat distribution and storage of domestic hot water systems | ||
| S-2.5 | Heat generation of domestic hot water systems | yes | [6] |
| S-2.6 | Solar thermal systems | ||
| S-2.7 | Ventilation systems | ||
| S-2.8 | Air-conditioning systems | ||
| S-2.9 | Control of central heating systems |
[1] Source of data: Czech Statistical Office, CSU 2001
[2] Source of data: PanelScan 2009
[3] Source of data: Sdružení EPS ČR
[4] Source of data: ISSAR database
[5] Source of data: Energy statistics, MoIT 2007
[6] Source of data: National estimate based on microcensus ENERGO 2004
S-1.1 Frequency of Building Types of National Building Stock
Single-unit housing
(single family houses and terrace houses) according to construction or refurbishment period.
Number of houses as per dwellings and storeys [1]
| Building period | Number of houses (1000) | |||||||
| Until 1920 | 1921 - 1945 | 1946 - 1960 | 1961 - 1980 | 1981 - 1994 | 1995 - 2011 | Total | ||
| Total | 199,8 | 271,5 | 113,6 | 370,3 | 277,0 | 294,1 | 1554,8 | |
| Number of dwellings in houses |
1 | 164,5 | 210,8 | 90,6 | 259,5 | 219,5 | 256,3 | 1226,8 |
| 2 | 32,7 | 56,1 | 22,3 | 108,3 | 55,9 | 36,0 | 314,0 | |
| 3 | 2,6 | 4,6 | 0,7 | 2,5 | 1,6 | 1,8 | 14,1 | |
| Number of storeys in houses |
1 | 122,4 | 115,1 | 53,0 | 116,8 | 74,4 | 99,6 | 584,1 |
| 2 | 65,1 | 137,2 | 56,1 | 238,9 | 188,0 | 174,4 | 861,8 | |
| 3 | 4,7 | 11,7 | 1,4 | 7,3 | 9,3 | 11,4 | 46,0 | |
Table 1
Last updated: 18.11.2013
Multi-unit housing
Multi-unit housing (apartment blocks and multi family houses) according to construction or refurbishment period.
Number of houses as per dwellings and storeys [1]
| Building period | Number of houses (1000) | |||||||
| Until 1920 | 1921 - 1945 | 1946 - 1960 | 1961 - 1980 | 1981 - 1994 | 1995 - 2011 | Total | ||
| Total | 26,1 | 27,8 | 30,6 | 71,4 | 31,7 | 19,0 | 211,3 | |
| Number of dwellings in houses |
2 | 2,1 | 1,4 | 0,7 | 0,9 | 0,8 | 0,9 | 7,0 |
| 3 | 3,1 | 2,3 | 0,5 | 0,6 | 0,6 | 1,1 | 8,5 | |
| 4 | 4,9 | 4,9 | 5,3 | 6,9 | 2,8 | 1,8 | 27,0 | |
| 5-9 | 11,7 | 11,1 | 16,6 | 21,8 | 8,1 | 6,2 | 77,1 | |
| 10-19 | 3,9 | 6,4 | 6,2 | 26,9 | 10,3 | 5,8 | 60,9 | |
| 20 and more | 0,4 | 1,7 | 1,3 | 14,3 | 9,2 | 3,2 | 30,8 | |
| Number of storeys in houses |
1 | 1,2 | 0,6 | 0,5 | 0,6 | 0,4 | 0,7 | 3,9 |
| 2 | 7,9 | 5,7 | 6,9 | 9,7 | 3,8 | 3,4 | 37,7 | |
| 3 | 7,7 | 8,9 | 11,2 | 12,2 | 4,8 | 4,9 | 49,9 | |
| 4 | 4,8 | 5,4 | 7,3 | 19,1 | 6,7 | 4,5 | 48,0 | |
| 5 | 3,2 | 3,9 | 2,9 | 8,6 | 2,5 | 2,2 | 23,4 | |
| 6 and more | 0,8 | 2,4 | 1,2 | 19,0 | 12,3 | 3,0 | 38,7 | |
Table 2
Heated area according to construction or refurbishment period and building size [1]
| Building period | Heated area [m²] | |
| Single family houses and terrace houses [1000 m²] |
Apartment blocks and multi family houses [1000 m²] |
|
| Until 1920 | 14 514,02 | 6 875,01 |
| 1921 - 1945 | 20 873,41 | 9 331,64 |
| 1946 - 1960 | 8 247,84 | 10 368,50 |
| 1961 - 1980 | 31 662,34 | 43 347,54 |
| 1981 - 1994 | 25 835,11 | 22 607,44 |
| 1995 - 2011 | 29 371,04 | 9 492,75 |
| Total | 131 433,40 | 104 201,18 |
Table 3
Last updated: 18.11.2013
S-1.2.1 State of Percentage of Thermally Refurbished Envelope Areas
Refurbishment of dwellings in prefabricated houses.
| Number of dwellings |
Percentage of dwellings in prefabricated houses |
Percentage of dwellings in refurbished prefabricated houses |
|
| Total number of dwellings in prefabricated houses | 1 199 168 | 100 % | |
| Refurbished | 659 414 | 55 % | 100 % |
| Replacement of windows | 544 481 | 45 % | 83 % |
| out of which appropriate implementation | 408 361 | 34 % | 62 % |
| Insulation | 475 878 | 40 % | 72 % |
| out of which appropriate implementation | 380 702 | 32 % | 55 % |
| Roof | 450 553 | 38 % | 68 % |
| out of which appropriate implementation | 337 915 | 28 % | 51 % |
| Loggia glazing | 197 824 | 16 % | 30 % |
Data up to 31 December 2008, including quality factor [2]
Table 4
Non-prefabricated dwellings according refurbishment [2]
| Number of non-prefabricated dwellings |
Percentage of non-prefabricated dwellings |
|
| Total number of dwellings n non-prefabricated houses | 961 562 | 100 % |
| At least partly refurbished | 118 207 | 12 % |
| Dwellings in need of refurbishment | 843 355 | 88 % |
| Adjusted number of dwellings in need of refurbishment* | 609 302 | 63 % |
* Correction factor should be applied to the number of non-prefabricated dwellings (843 355). It should be borne in mind that unlike prefabricated houses not all non-prefabricated residential houses are standard refurbishment repairable. The total number of dwellings in non-prefabricated residential houses was reduced to 609 302.
Table 5
Last updated: 18.11.2013
S-1.2.2: Average Insulation Thicknesses (eq EPS 70F) added to the refurbished elements and U-Values of new windows
| 1998 | 2008 | 2012 (estimation) |
Remarks | |
| walls | 50-60 mm | 85 mm | 100 mm | [1] |
| windows U values (W/m².K) | 2,3-2,8 | 1,4-1,8 | 0,8-1,2 | [2] |
| roofs / upper floor ceilings | 120 mm | 160 mm | 220 mm | [2] |
| basement / cellar ceiling | 50 mm | 75 mm | 100 mm | [2] |
[1] the source of data: Sdružení EPS ČR
[2] mainly based on estimations and standard requirements
S-1.2.2 Information on Insulation Level and Window Types
Factors decreasing the quality of the window replacement in prefabricated houses
| Window replacement | Number of dwellings | |
| Total | 544 481 | |
| Inadequate heat transfer coefficient U (according to ČSN 730540:2002) | 38 114 | 7 % |
| Structural defects of window frames | 27 224 | 5 % |
| Anchorage defects of window frames | 38 114 | 7 % |
| Condensation | 16 334 | 3 % |
| Mould | 16 334 | 3 % |
| Appropriate implementation | 408 361 | 75 % |
Data up to 31 December 2008 [2]
Table 6
Factors decreasing the quality of the roof refurbishment in prefabricated houses
| Roof refurbishment | Number of dwellings | |
| Total | 450 553 | |
| Repair without improving thermal insulation | 22 528 | 5 % |
| Wrong technology | 45 055 | 10 % |
| Non respect of technological rules | 22 528 | 5 % |
| Poor quality of implementation | 22 528 | 5 % |
| Appropriate implementation | 337 915 | 75 % |
Data up to 31 December 2008 [2]
Table 7
Factors decreasing the quality of the insulation refurbishment in prefabricated houses
| Insulation refurbishment | Number of dwellings | |
| Total | 475 878 | |
| Low insulation thickness | 14 276 | 3 % |
| Low quality of surface | 9 518 | 2 % |
| Inadequate composition of layers | 4 759 | 1 % |
| Wrong implementation details | 23 794 | 5 % |
| Non respect of technological rules | 23 794 | 5 % |
| Inappropriate management of winter effects | 4 759 | 1 % |
| Inappropriate colour | 4 759 | 1 % |
| Mould | 4 759 | 1 % |
| Mechanical damage, vandalism | 4 759 | 1 % |
| Appropriate implementation | 380 702 | 80 % |
Data up to 31 December 2008 [2]
Table 8
Last updated: 18.11.2013
S-2.1 Centralization of Heat Supply (for Space Heating)
Centralization of heat supply for space heating [3]
| Number of dwellings | Space heating systems | |||||||
| Centralized heating | Local heating | |||||||
| A | B | C | D | E | F | G | H | |
| Fuel |
Total centralized heating |
Central heating (building or apt.) |
Collective heating |
District heating |
Complementary heating |
Kitchen stoves |
Stoves |
Open fires |
| Total number | 3 489 122 | 1 931 195 | 386 680 | 1 171 248 | 32 522 | 73 220 | 812 772 | 61 461 |
| Electricity | 28 480 | 364 723 | ||||||
| Natural gas | 1 116 126 | 1 116 126 | 3 307 | 239 137 | ||||
| LPG | 3 859 | 3 859 | 2 848 | |||||
| Heat | 1 557 928 | 386 680 | 1 171 248 | |||||
| Hard coal | 46 119 | 46 119 | 3 583 | 9 371 | ||||
| Coke | 37 299 | 37 299 | 184 | 2 205 | ||||
| Wood | 367 938 | 367 938 | 735 | 69 362 | 115 940 | 61 461 | ||
| Other fuels | 359 854 | 359 854 | 92 | 78 549 | ||||
Table 9
Number of dwellings with district heating according to year [4]
| Year | Number of dwellings with district heating in the year (1000) |
Percentage of number of dwellings with district heating in the year [%] |
| 1991 | 1369,0 | 36,95 |
| 2001 | 1447,0 | 38,16 |
| 2002 | 1449,9 | 38,01 |
| 2003 | 1449,4 | 38,04 |
| 2004 | 1457,2 | 37,70 |
| 2005 | 1462,8 | 37,60 |
| 2006 | 1467,2 | 37,42 |
| 2007 | 1474,5 | 37,24 |
| 2008 | 1479,4 | 37,03 |
| 2009 | 1484,9 | 36,84 |
| 2010 | 1490,6 | 36,66 |
Table 10
Energy consumption in the households according to year [4]
| Year |
Energy consumption |
Heating Energy |
Heating energy |
| 2006 | 50 570 | 294 271 | 17,2 |
| 2007 | 47 626 | 276 972 | 17,2 |
| 2008 | 47 971 | 272 545 | 17,6 |
| 2009 | 46 654 | 272 621 | 17,1 |
| 2010 | 50 165 | 298 250 | 16,8 |
Table 11
Last updated: 18.11.2013
Statistic S-2.1: Heat Supply in the Households
(% of dwellings)
| Year | District heating [%] | Other | |||||
| Solid fuel [%] | Fuel oil [%] | Gas [%] | Propan-butan [%] | Electricity [%] | Other [%] | ||
| 1991 | 36,95 | 43,78 | 16,57 | 0 | 1,5 | 1,2 | |
| 2009 | 36,84 | 17,62 | 0,09 | 39 | 0,2 | 6,25 | 0 |
Source of data: ISSAR database
S-2.2 Heat Distribution and Storage of Space Heating Systems
Currently in the Czech Republic there are not statistics on heat distribution and storage of space heating systems in residential buildings.
S 2.3. Fuel Consumption for the Heat Generation and Delivery to the Households (heating+DHW)
| Fuel and technology | Decentralized heating | District heating | Total |
| (TJ) | (TJ) | (TJ) | |
| Brown coal | 20056,6 | 39607,3 | |
| Brown coal graded | 17307,3 | ||
| Briquettes | 2229,3 | ||
| MULTI powder | - | ||
| Lignite | - | ||
| Lignite graded | 14,1 | ||
| Black coal | - | 5068,2 | 8106,1 |
| Black coal graded | 2486,3 | ||
| Black coal sediments and granulate | 37,5 | ||
| Coke | 514,1 | ||
| Wood | 29481 | 720,6 | 30202 |
| Wood chips, wood waste | |||
| Wood pellets and briquettes | |||
| Vegetal materials non agglomerated | - | ||
| Cellulose extracts | - | ||
| Other biomass | - | ||
| MSW | - | 1523,4 | 1523,4 |
| Industrial and hospital waste | - | ||
| Alternative and other fuels | - | ||
| Carbon deposits | - | - | - |
| Fuel oil | - | 1535,8 | 1535,8 |
| Tar mixture | - | 296 | 1124,9 |
| Organic chemicals | - | ||
| LPG | 828,9 | ||
| Other liquid fuels | - | ||
| Natural gas | 88522,1 | 17278,8 | 105800,9 |
| LFG | - | - | - |
| Other biological gas | - | - | - |
| Degazation gas | 840,2 | 840,2 | |
| Gasworks gas | |||
| Coke oven gas | |||
| Blast furnace gas | |||
| Oxygen steel furnace gas | |||
| Other types of gas | |||
| Electricity | 25191,6 | 3,7 | 25195,3 |
| Waste heat, recovered heat | - | - | 812,3 |
| Nuclear fuel | - | ||
| Solar collectors | 118 | ||
| Heat pumps | 694,3 | ||
| TOTAL (TJ) | 167424,9 | 47323,4 | 214748,2 |
Source of data: Energy statistics, MoIT 2007
S-2.3 Heat Generation of Space Heating Systems
Heat supply in the household according to construction or refurbishment period and heating method [1]
| Construction or refurbishment period | Number of dwellings (1000) | |||||||||||
| Central heating |
Floor heating (with boiler in the dwelling) |
Stoves |
Other heating method |
|||||||||
| Boiler room outside house |
Boiler room inside house |
Coal, |
Wood, |
Gas | Electricity |
Coal, |
Wood, |
Gas | Electricity | |||
|
On solid fuel |
On gas |
|||||||||||
| Until 1919 | 182,0 | 58,0 | 97,5 | 11,3 | ||||||||
| 7,2 | 174,6 | 4,4 | 2,2 | 45,4 | 3,4 | 11,3 | 20,5 | 37,7 | 24,1 | |||
| 72,3 | 92,6 | |||||||||||
| 1920 -1945 | 309,4 | 71,1 | 115,6 | 9,5 | ||||||||
| 25,0 | 284,1 | 3,0 | 1,5 | 60,7 | 3,5 | 7,7 | 13,1 | 64,4 | 26,7 | |||
| 81,7 | 187,5 | |||||||||||
| 1946 -1970 | 788,0 | 65,7 | 69,4 | 7,8 | ||||||||
| 456,5 | 330,6 | 5,3 | 2,6 | 52,1 | 3,6 | 6,0 | 11,4 | 28,0 | 21,8 | |||
| 102,7 | 211,2 | |||||||||||
| 1971 -2000 | 1656,0 | 70,3 | 53,6 | 6,6 | ||||||||
| 844,7 | 809,8 | 4,0 | 2,2 | 57,6 | 4,3 | 2,5 | 8,1 | 9,5 | 31,8 | |||
| 253,7 | 505,4 | |||||||||||
| 2001 -2011 | 319,6 | 20,4 | 16,1 | 4,1 | ||||||||
| 67,0 | 251,2 | 0,1 | 0,4 | 15,5 | 3,4 | 0,3 | 4,2 | 2,0 | 9,2 | |||
| 41,6 | 174,7 | |||||||||||
| Total | 3255,0 | 285,5 | 352,2 | 39,3 | ||||||||
| 1400,4 | 1850,3 | 16,8 | 8,9 | 231,3 | 18,2 | 27,8 | 57,3 | 141,6 | 113,6 | |||
| 552,0 | 1171,4 | |||||||||||
Table 12
Number of dwellings according to heating method [1]
| Heating method | Number of dwellings (1000) | ||||
| in single-unit housing | in multi-unit housing | ||||
| Central heating - total | 1520,3 | 1749,2 | |||
| Central heating - boiler room inside house |
On solid fuel | 507,6 | 43,0 | ||
| On gas | 882,2 | 273,8 | |||
| Floor heating | Coal, coke, coal briquettes | 52,4 | 7,2 | 237,5 | 9,6 |
| Wood, wooden briquettes | 5,1 | 4,0 | |||
| Gas | 31,8 | 203,2 | |||
| Electricity | 5,8 | 12,8 | |||
| Stoves | Coal, coke, coal briquettes | 163,5 | 21,6 | 190,2 | 6,4 |
| Wood, wooden briquettes | 45,6 | 12,2 | |||
| Gas | 32,5 | 110,2 | |||
| Electricity | 56,5 | 56,8 | |||
Table 13
Last updated: 18.11.2013
S-2.4 Heat Distribution and Storage of Domestic Hot Water Systems
Currently in the Czech Republic there are not statistics on heat distribution and storage of domestic hot water systems in residential buildings.
S-2.5 Heat Generation of Domestic Hot Water Systems
Number of dwellings according to DHW equipment and construction or refurbishment period [1]
| Construction or refurbishment period | Number of dwellings (1000) | |||||
| Source outside the building | Electric water heater, flow water heater | Gas water heater, flow water heater | Solar thermal system | Other or combined source | Without DHW | |
| Until 1919 | 4,1 | 186,4 | 102,5 | 0,5 | 17,6 | 24,3 |
| 1920 - 1945 | 20,5 | 234,6 | 184,3 | 0,7 | 26,6 | 18,3 |
| 1946 - 1970 | 399,8 | 239,5 | 199,0 | 1,0 | 32,5 | 12,7 |
| 1971 - 2000 | 789,2 | 486,1 | 329,4 | 3,8 | 72,0 | 8,7 |
| 2001 - 2011 | 68,8 | 96,3 | 134,8 | 2,4 | 28,6 | 2,2 |
| Total | 1282,4 | 1242,9 | 950,0 | 8,4 | 177,3 | 66,2 |
Table 14
Last updated: 18.11.2013
S-2.6 Solar Thermal Systems
Installed area of solar collectors in the households according to usage in the year 2004 [3]
| Percentage rate | Installed area approx. [m²] | |
| Total in the year 2004 | 100 % | |
| Household (only DHW) | 20 % | 1825 |
| Household (DHW + heating) | 31 % | 2825 |
| Household (only pool heating) | 6 % | 550 |
| Household, total | 57 % | 5200 |
Table 15
Installed area of solar collectors in the households from 1990 to 2004 [3]
| Solar collectors in Czech Republic (since 1990) | ||
| Percentage rate | Installed area approx. [1000 m²] |
|
| Total from 1990 to 2004 | 100 % | 50 |
| Household | 60 % | 30 |
| Household (with pool heating) | 70 % | 35 |
Table 16
Average size of solar collectors in the households [3]
| Household (only DHW) [m²] |
Household (DHW+ heating) [m²] |
Household (only pool heating) [m²] |
|
| Flat collectors | 4,67 | 12,34 | 8,95 |
| Tube collectors | 3,53 | 10,96 | - |
| Unglazed absorbers | - | - | 10,58 |
Table 17
Last updated: 18.11.2013
S-2.7 Ventilation Systems
Currently in the Czech Republic there are not statistics on ventilation systems in residential buildings.
Last updated: 18.11.2013
S-2.8 Air-conditioning Systems
Currently in the Czech Republic there are not statistics on air-condition systems in residential buildings.
Last updated: 18.11.2013
S-2.9 Control of Central Heating Systems
Currently in the Czech Republic there are not statistics on control of central heating systems in residential buildings.
Last updated: 18.11.2013
References
[1] Czech Statistical Office, CENSUS 2011 (Counting people, flats and houses)
[2] CERPAD (Regeneration Centre of Prefabricated Houses), PanelSCAN 2009
[3] Czech Statistical Office, ENERGO 2004
[4] Klíčové indikátory ŽP ČR – energetika a průmysl (Key environmental indicators of Czech Republic – energy and industry), http://issar.cenia.cz/issar/page.php?id=1566
Last updated: 18.11.2013
National Scientific Report Czech Republic
Fundamentals and elements of the national residential building typology
Download:<CZ_TABULA_ScientificReport_STU-K.pdf>
(in English Language)
Last updated: 18.05.2012
